Airport traffic use case tutorial
Welcome to PapAI, a state-of-the-art platform that lets you build your data science pipeline from start to finish. With PapAI, you can collect data, pre-process it, train models, and deploy them with ease. In this tutorial, we'll build together a use case with the PapAI platform, explaining how we can predict the number of passengers at an airport in the coming months.
The database we're using contains information on the number of passengers in the airport per month, between July 2005 and June 2018, and this tutorial aims to predict the number of passengers in the airport in the 5 years following the last date of our dataset, (i.e., between June 2018 and June 2023) by using PapAI
Note
You can download here the dataset example used in this tutorial and to follow it step by step !
Create a project
As a user of PapAI, you will be directed to your project homepage upon logging in. This page displays all the projects that you have either created or are collaborating on with other members. To start a new project, simply click on the New project button, which will open a pop-up window with various settings to fill in. These settings include the name of your project, a brief description, the persistency setting, and the sampling technique you wish to apply. You can choose the number of samples to be displayed and the order selection, such as the first or last N rows or randomly. Once you have filled in all the necessary settings, you can finalize the process by clicking on the Create button. Your new project will then be automatically added to your main page, ready for you to start working on. With PapAI, starting a new project has never been easier!
Here is a video showing the project creation process on papAI
Import datasets
Thanks to the variety of data sources available, you have the flexibility to import data from virtually anywhere into your papAI project for analysis and visualization. Whether it's from your local machine, an external database (SQL or NoSQL), cloud storage, or an API, papAI makes it easy to bring in data for analysis. Additionally, you can even create a completely new dataset using the specialized Python or SQL recipe editor.
Here is a video showcasing the data import process on papAI
To get started with importing your data, you can use the tools provided in the papAI interface. For our specific use case, we'll be importing our dataset from our local machine using the appropriate tool. You can access this tool by clicking the plus button located in the top right corner of the interface or by using the Import dataset button in the Flow interface.
Here is a video of importing a dataset from a local machine
Once you've selected the local import option, a new interface will appear that allows you to easily import any tabular file in CSV or XLSX format. You can import your desired files either by clicking the Import button or by using the drag-and-drop feature. Once your data has been imported, you can preview a subset of the data to verify that it was imported correctly. After ensuring that everything is in order, you can simply select the Import button to start the uploading process. A progress bar will keep you informed of the status of the upload, and when it's complete, your dataset will be ready for use in your project's flow.
Visualizing and analyzing the dataset
Once you've imported your dataset into PapAI, you can begin exploring its content and obtaining an initial analysis to determine the cleaning steps necessary to extract the most valuable insights from your data. However, before diving into preprocessing, it's essential to explore the structure of the data through data visualization.
Before that, we double-click on the database, and this allows us to view the structure of our database.
Here a video that shows how visualize the content of the data
Thankfully, papAI makes it easy to visualize your data with a dedicated module accessible by double-clicking on the desired dataset and selecting the Visualization tab located on the top right-hand side of the interface. From there, you can select from a variety of graph options and choose which columns or aggregation of columns to represent and display in your desired graph. For some graphs, you can even define a colormap for a legend and filter out specific values to focus on specific aspects of your data.
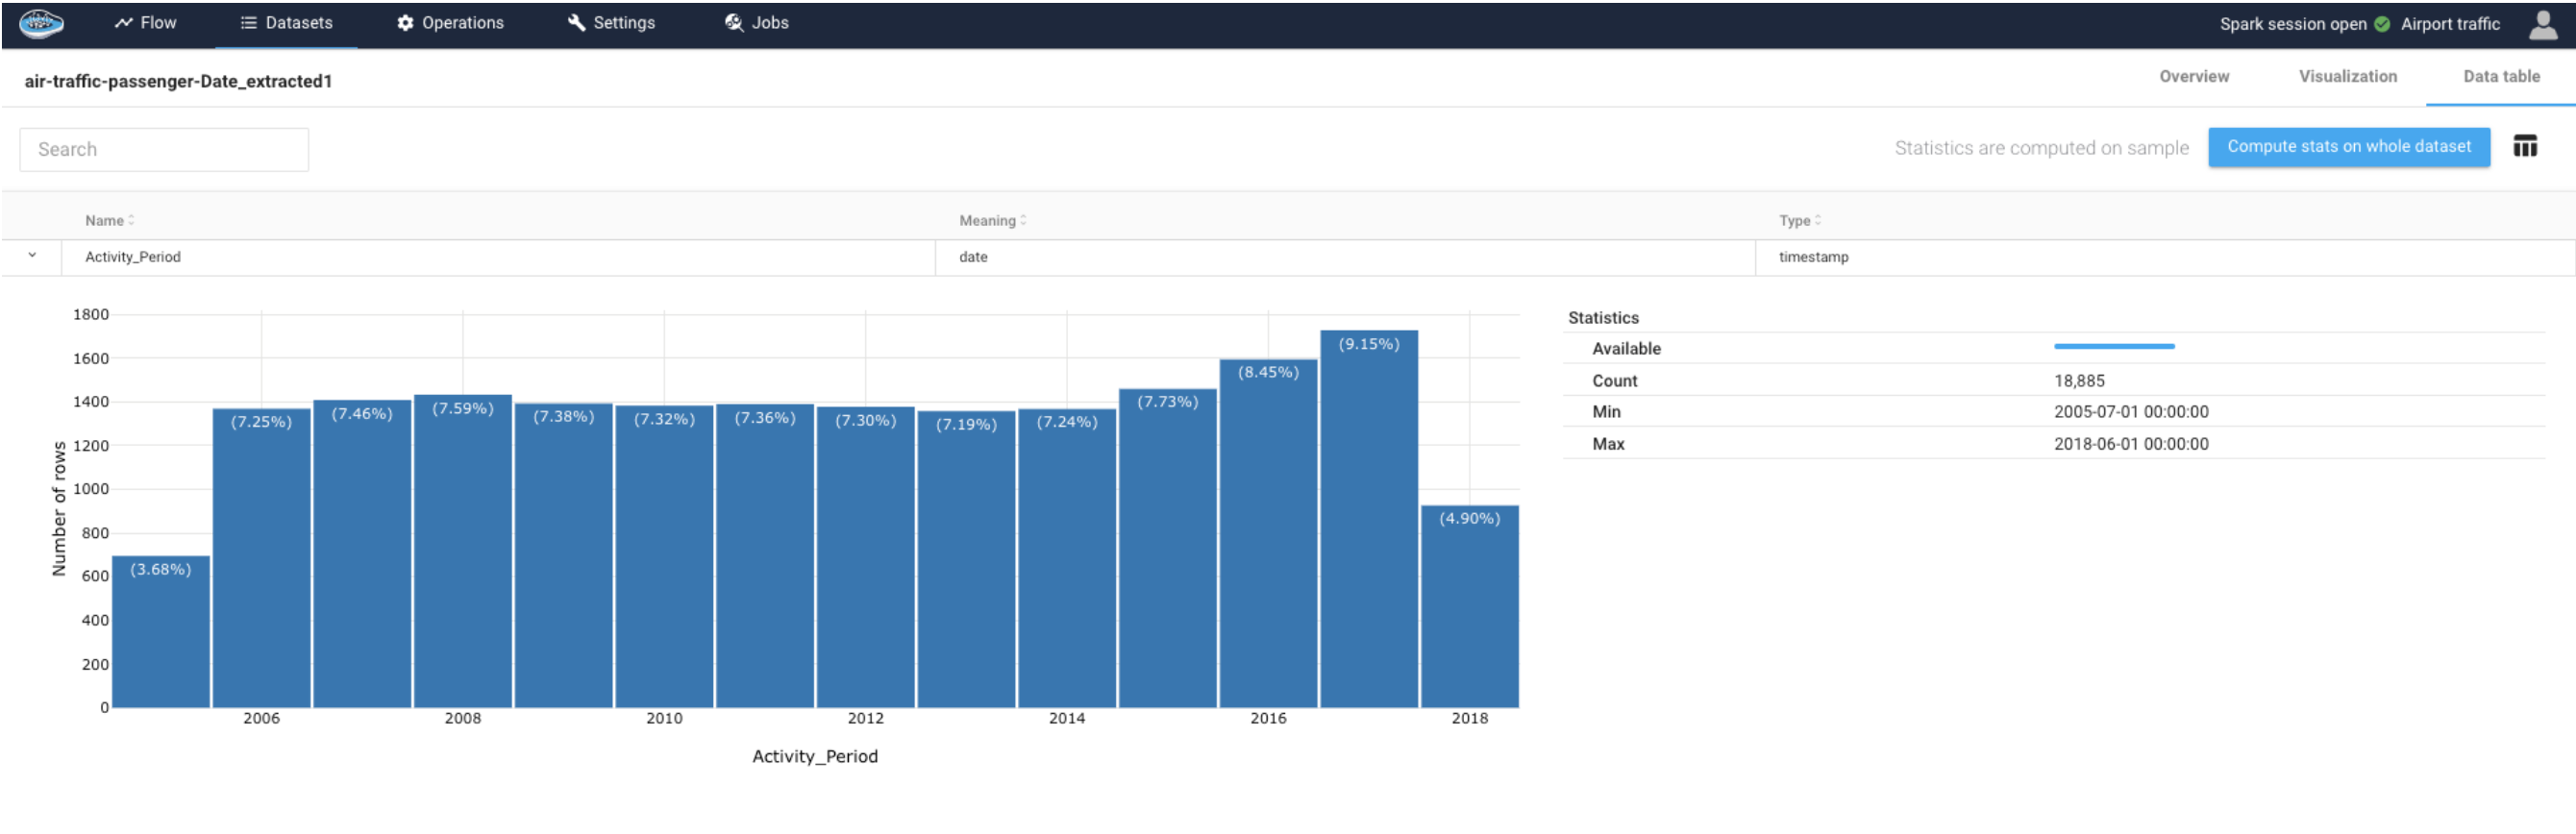
If you want to take your data analysis to the next level, you can also use descriptive statistics to uncover trends and better understand how your data is distributed. In papAI, you can easily access these statistics by selecting the Statistics tab from the table interface.
Here a video showing the generated statistics by papAI
This interface allows you to quickly view the key statistics for each column in your dataset, including the median, mean, and standard deviation. Additionally, you can view graphs that illustrate the distribution of your data, such as box plots and histograms, to get a more comprehensive understanding of its characteristics.
By analyzing these descriptive statistics, you can gain a deeper understanding of your data and identify any potential outliers or trends that may require further investigation. This information can then be used to inform your preprocessing and modeling decisions to create more accurate and reliable results.
Observations
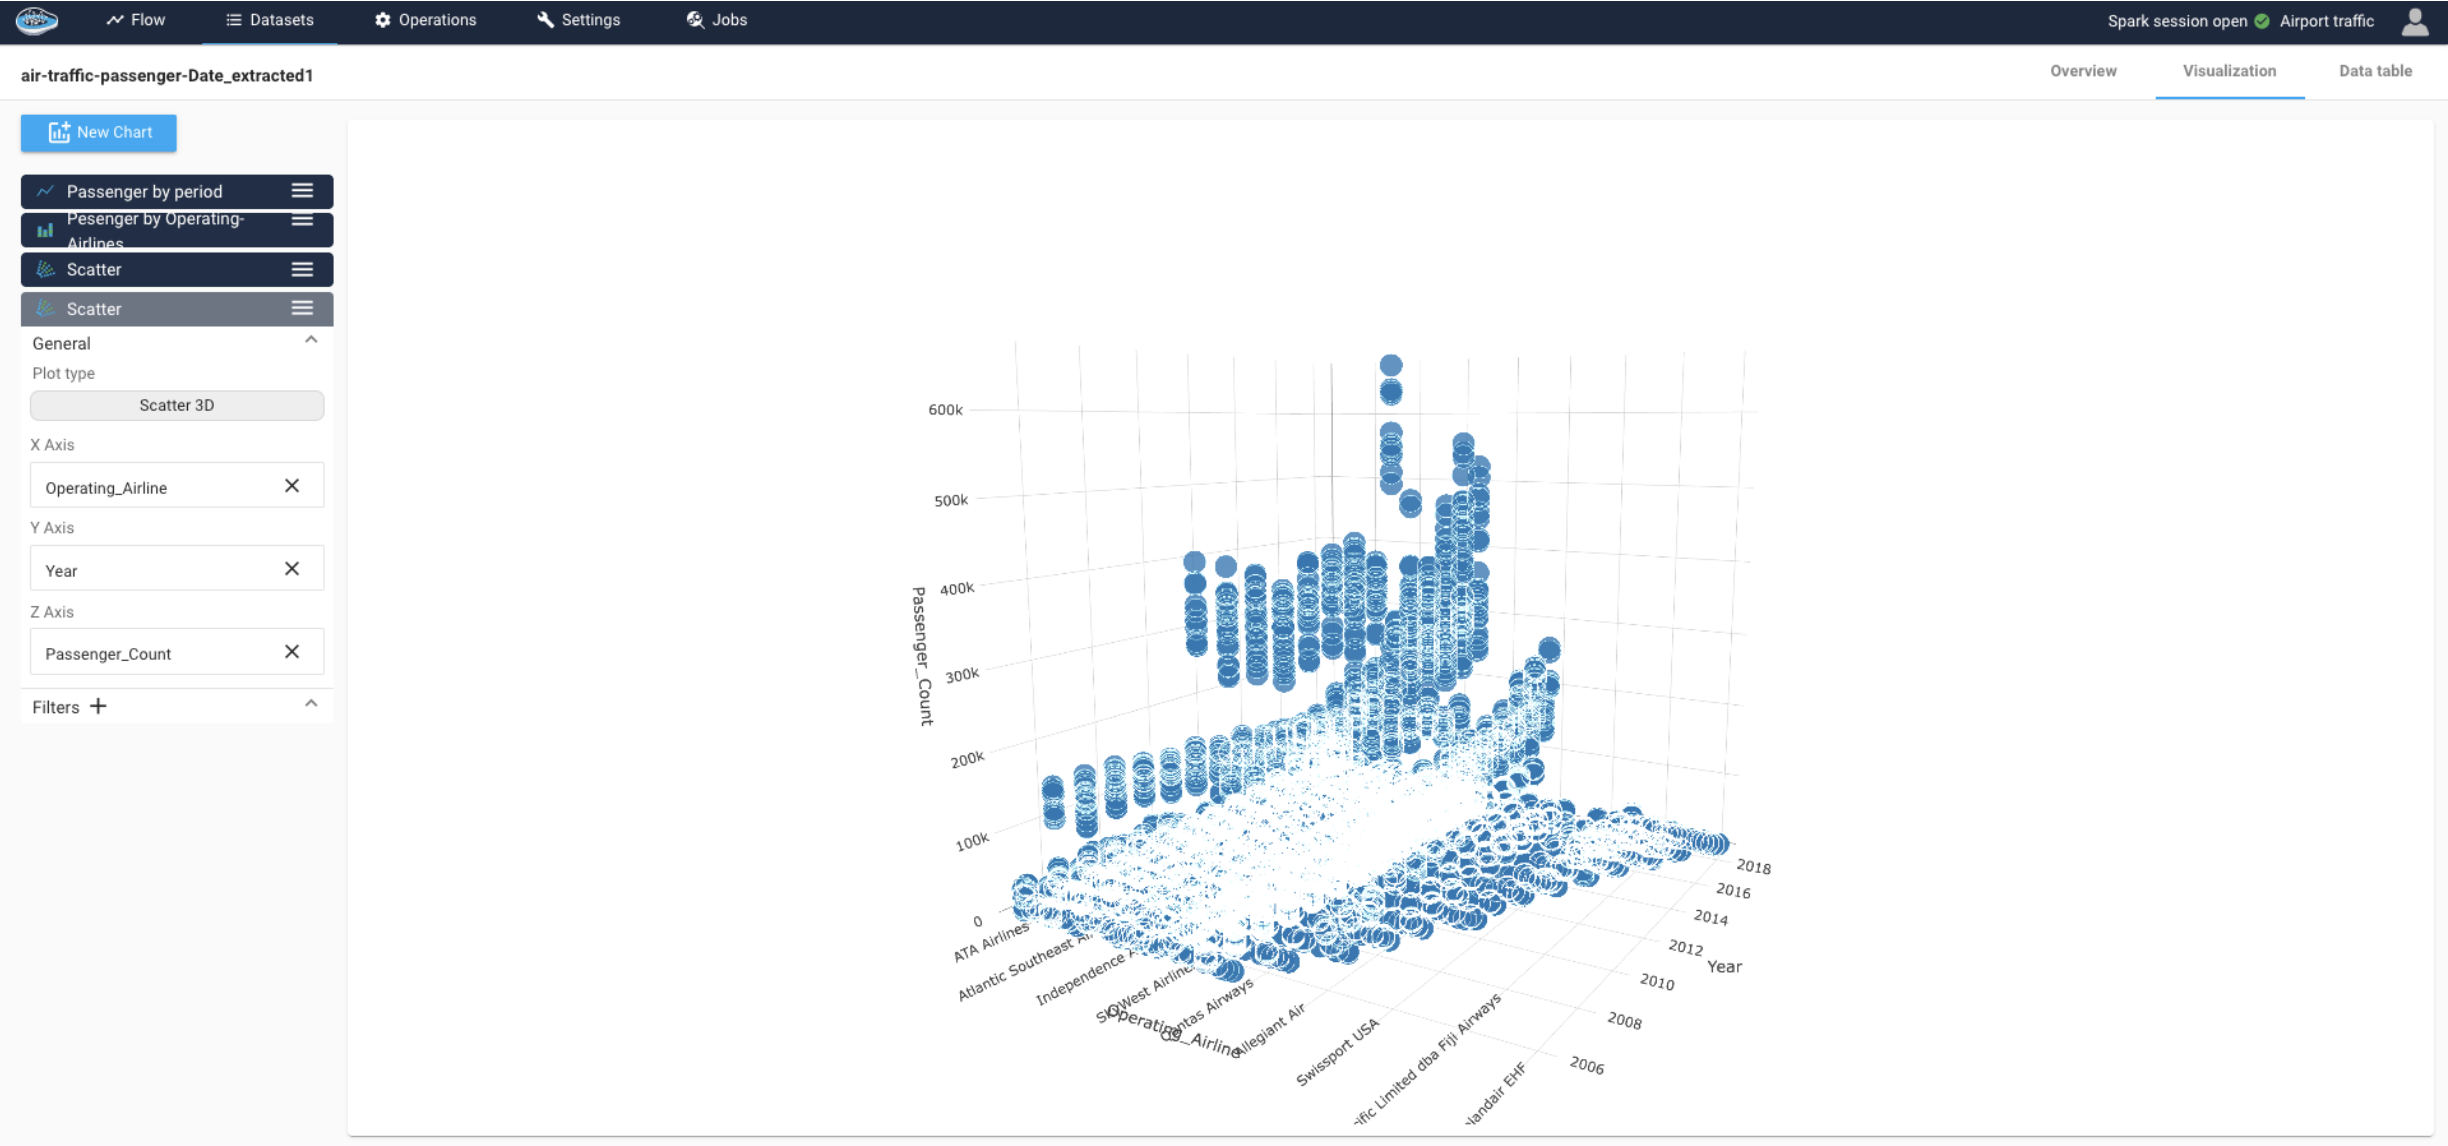
Before launching a machine learning model, we have made some visualizations on our database that will allow us to get into the subject. The papAI platform generates all forms of visualization 2D, 3D or Map if we put information on the latitude and the longitude of localization of our information.
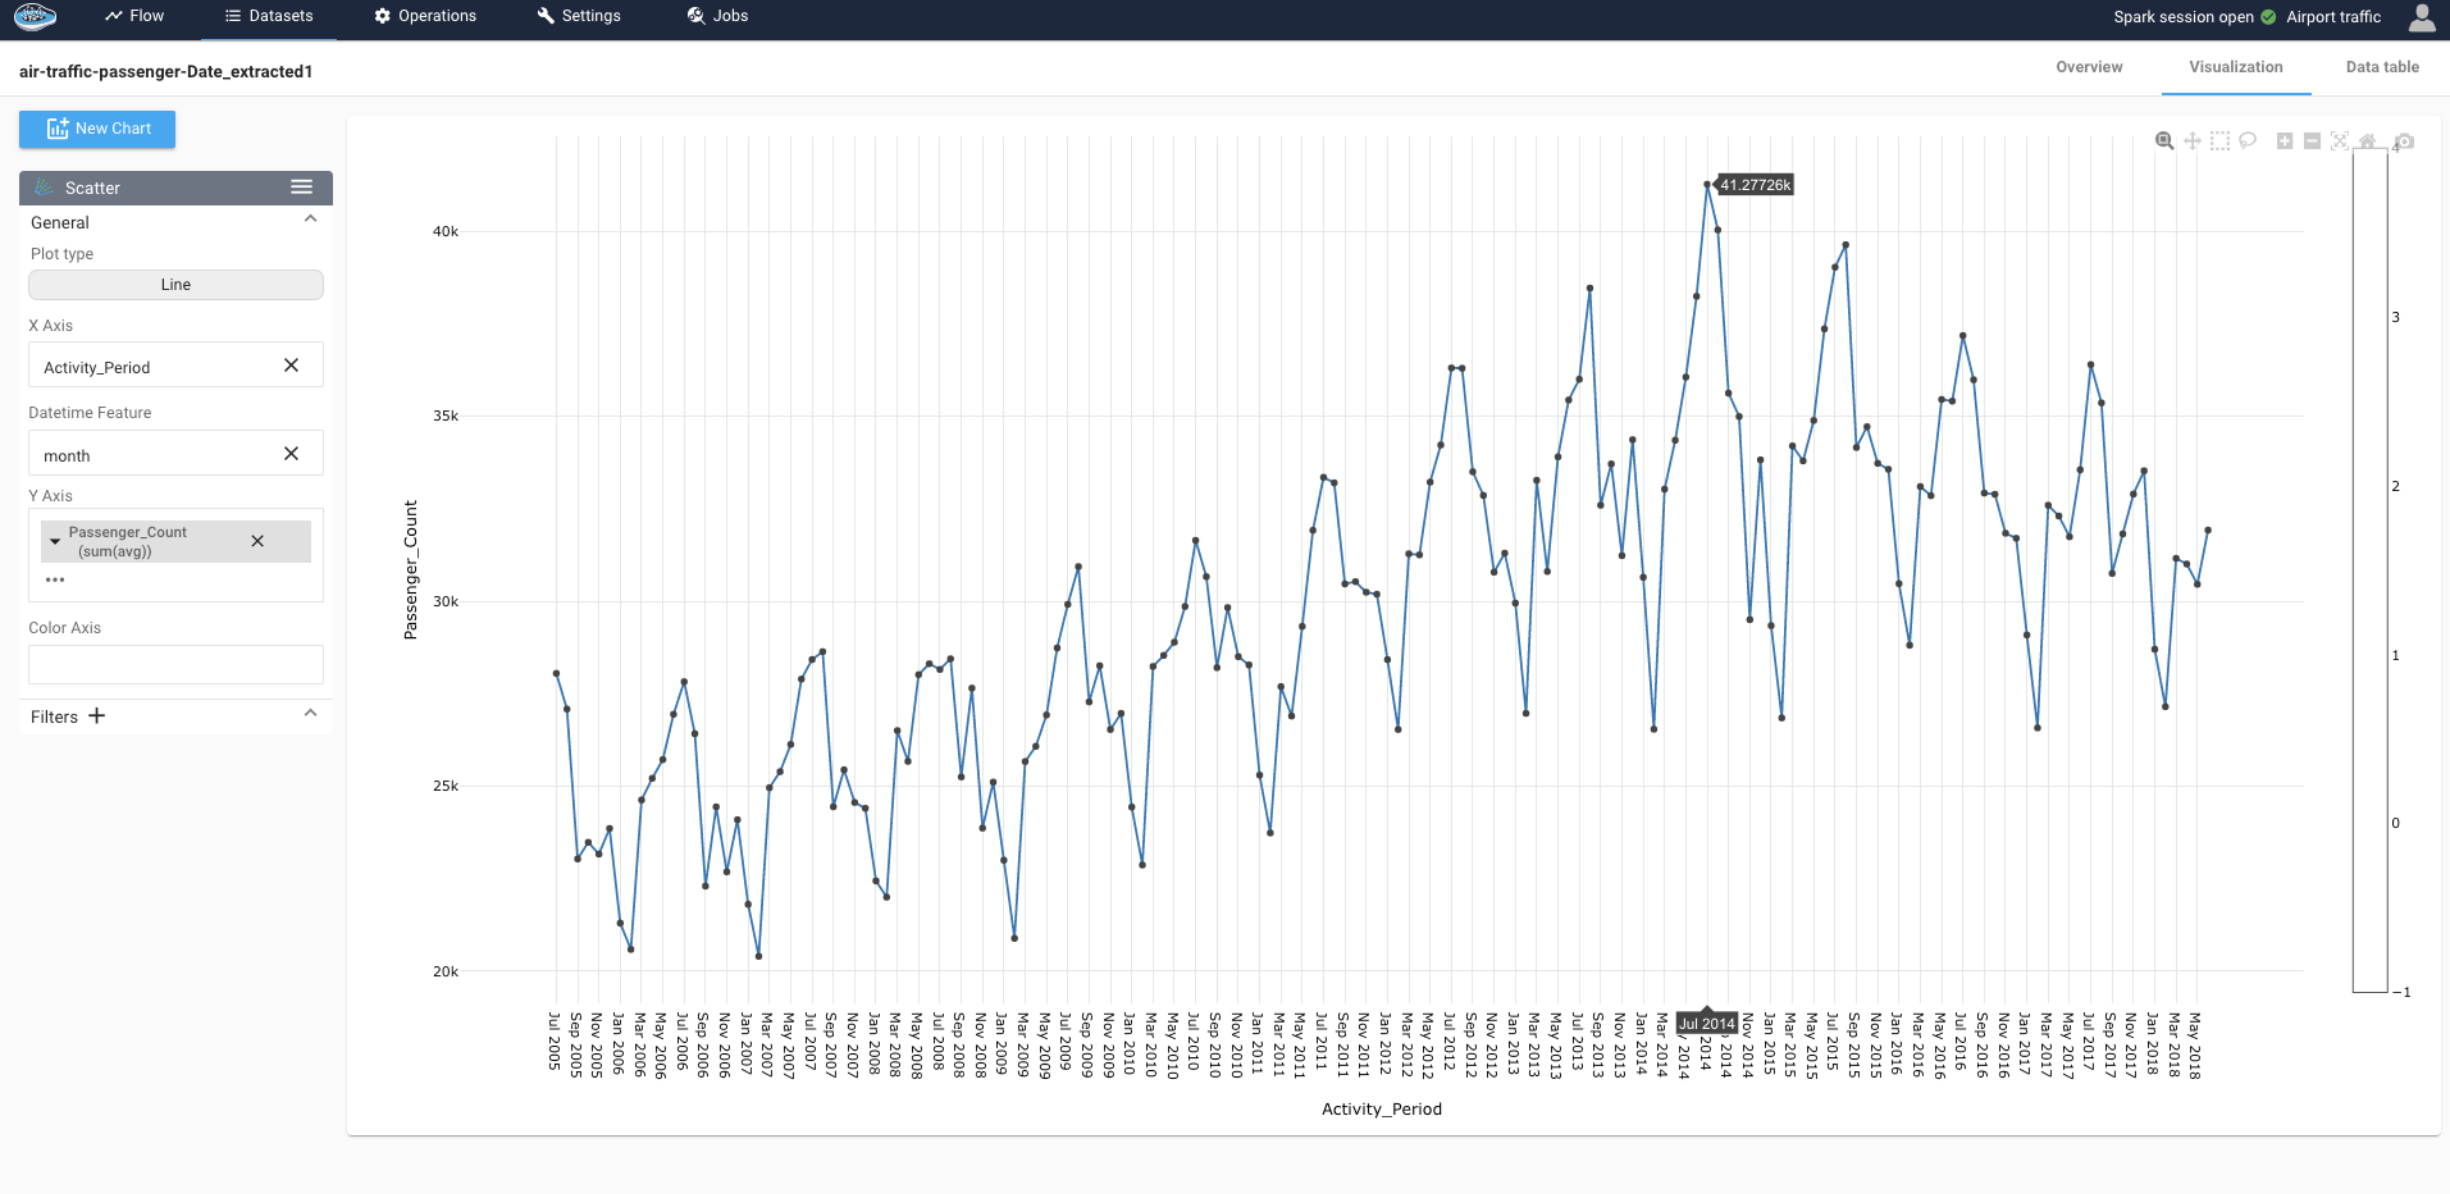
- The first observation on our dataset, concerning the total number of passengers (in thousands) at San Francisco airport over time, is that the number of passengers generally increases from year to year
- The second one is if we plot the number of passengers per period, we see a clear seasonal pattern with a period of about one year. The peak of traffic is around summer, while the lowest traffic is in winter, at the beginning of the year.
- The final observation is by doing a 3D display of the number of passengers over time for each airline, we can see the average number of passengers per airline each year and calculate its share of total traffic :
- United Airlines,
- SkyWest Airlines,
- American Airlines,
- Virgin America,
- Delta Airlines
Clean your data
In order to study a time series case, we first need to change the type of the Activity_Period column to timestamp, which is the ideal format for papAI to use the Time-Series cleaning module, For this operation, we have to use a python recipe to convert date to the needed format.
To use the Python recipe, we have to :
- Choose the dataset input
- Click on the Python script on the left of the screen
- We must specify the name of the input dataset by this syntax
df = import_dataset("my_dataset")
- Write our script
df.loc[:,"Activity_Period"] = pd.to_datetime(df.loc[:,"Activity_Period"].astype(str), format="%Y%m")
df.loc[:,"Year"] = df["Activity_Period"].dt.year
df.loc[:,"Month"] = df["Activity_Period"].dt.month
- We must specify the name of the output dataset by this syntax
export_dataset(df, "my_output_dataset")
Here is a video that shows the script used through the Python recipe
After having set the type that suits our columns, we have to resample our table, in order to have a single interval between all the data. The solution recommends us frequencies of resampling, we notice that the intervale which intervenes the most is 31 days.
Here is a video that shows how to create a Time-Series Forecasting use case and also check if the data is ready for model training
After choosing the date interval of our data, we choose the target we want to predict, which is the number of passengers, and we set the sum to take the number of passengers over each month.
Here is a video that shows the data resampling process with TS cleaning operation
Train the model
After the cleaning step, your dataset is ready for training any ML model. With our AutoML module, you can simply create multiple model experiments from built-in scalable ML algorithms with just a few clicks. You can build your own pipeline to create the best possible model with no-code capabilities, which is useful for practitioners or non-data experts.
We reproduce the last step for creating an ML task, but this time, we will have access to the papAI experiments because the dataset has been well prepared.
In order to create a Time-Series Forecasting, the first step is to choose the number of past data points on which our model will train, we chose 125 data points, which is the total amount of our dataset, so our model will train on all the dataset, and predict 80 points in the future (FUTURE) which represents 6 years and 6 months.
Here is a video that shows how creating the ML pipeline and experiments
With our AutoML module, you can simply create multiple model experiments from built-in scalable ML algorithms with just a few clicks. You can build your own pipeline to create the best possible model with no-code capabilities, which is useful for practitioners or non-data experts.
After running several models at the same time, we have a ranking of the results obtained, on which we can notice that the best result was obtained with PROPHET in dark green, and the lowest result was with the FFT Models. We promote the best result to make the prediction with.
Analyze & Understand the model
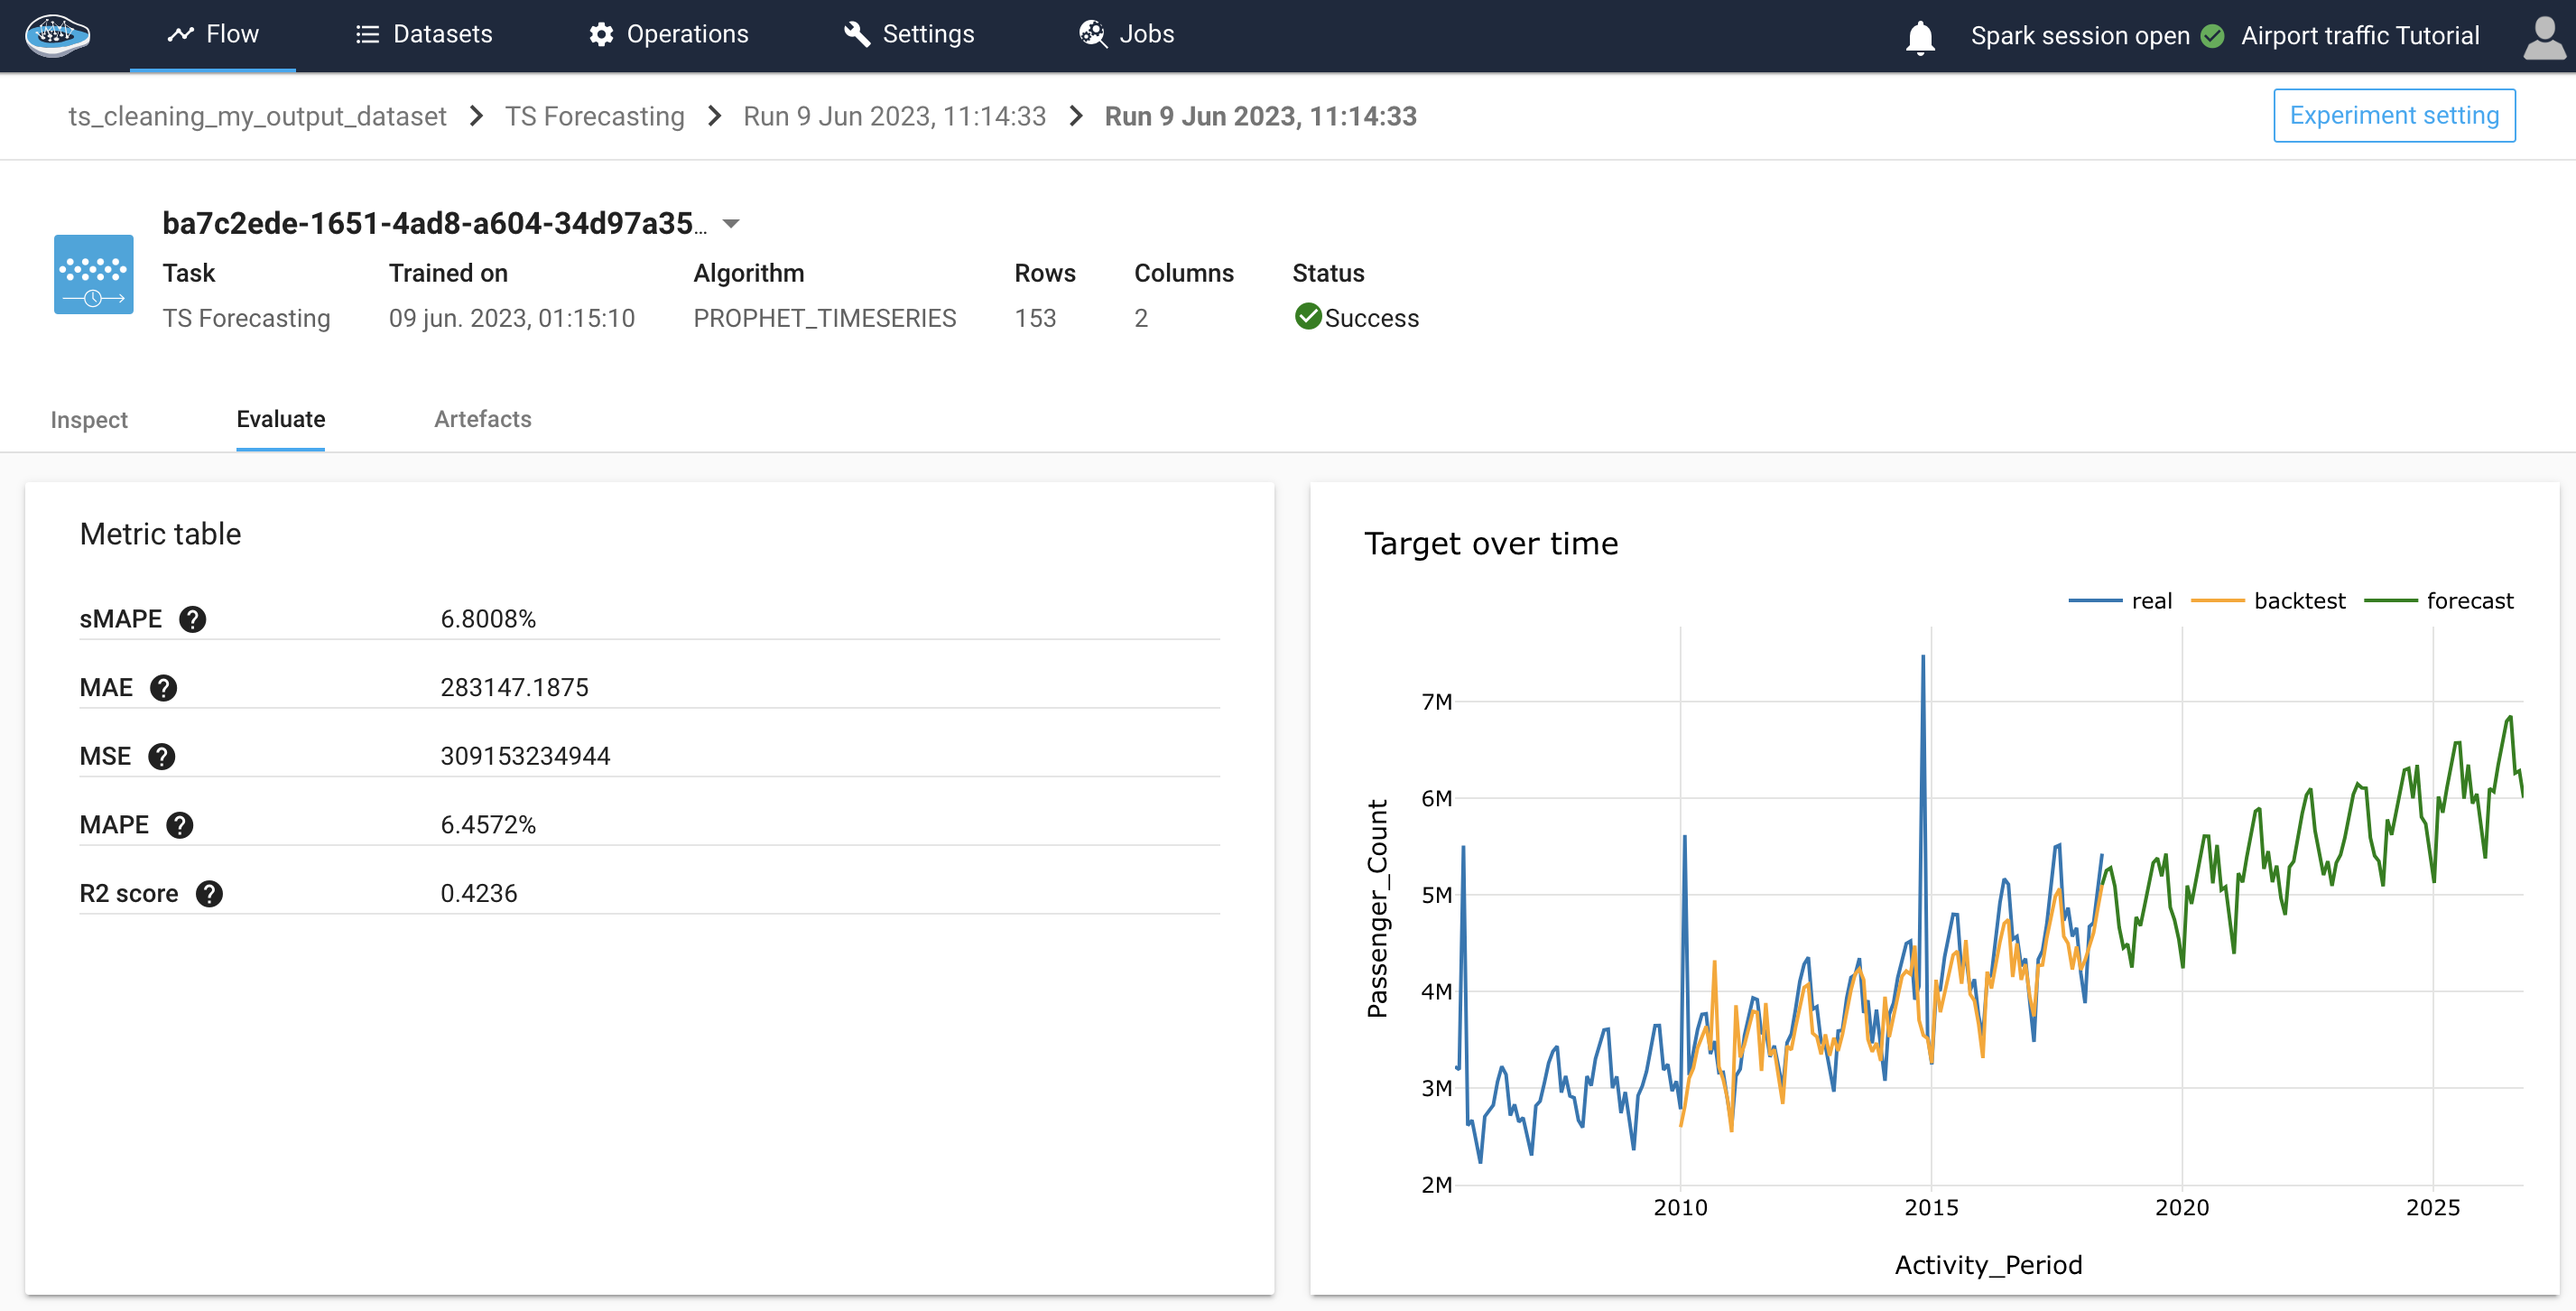
In order to evaluate the quality of the trained model, PapAI integrates an applicability module for each experiment created, In our case we can notice that the backtest, which are predicted values on years, where we already had the number of passengers. The result is clearly satisfactory, as the orange points overlap with the blue points, and the green points represent the forecast.
Predict the future number of passengers
To predict with a model, we must first export our model to the flow through a model registry
Here is a video that shows how export the chosen model on the flow
Now that the chosen model is in flow, all we have to do is make a prediction by pressing on the model, then we choose the dataset on which we want to make the prediction.
Here a video that show how we make a prediction, with created model
So we can visualize the number of passengers per month, in the coming months
Congratulations on completing this tutorial! I hope you found it informative and enjoyable.
Info
For more tutorials showcasing other features of papAI, I invite you to check this link. Best of luck with your future projects.