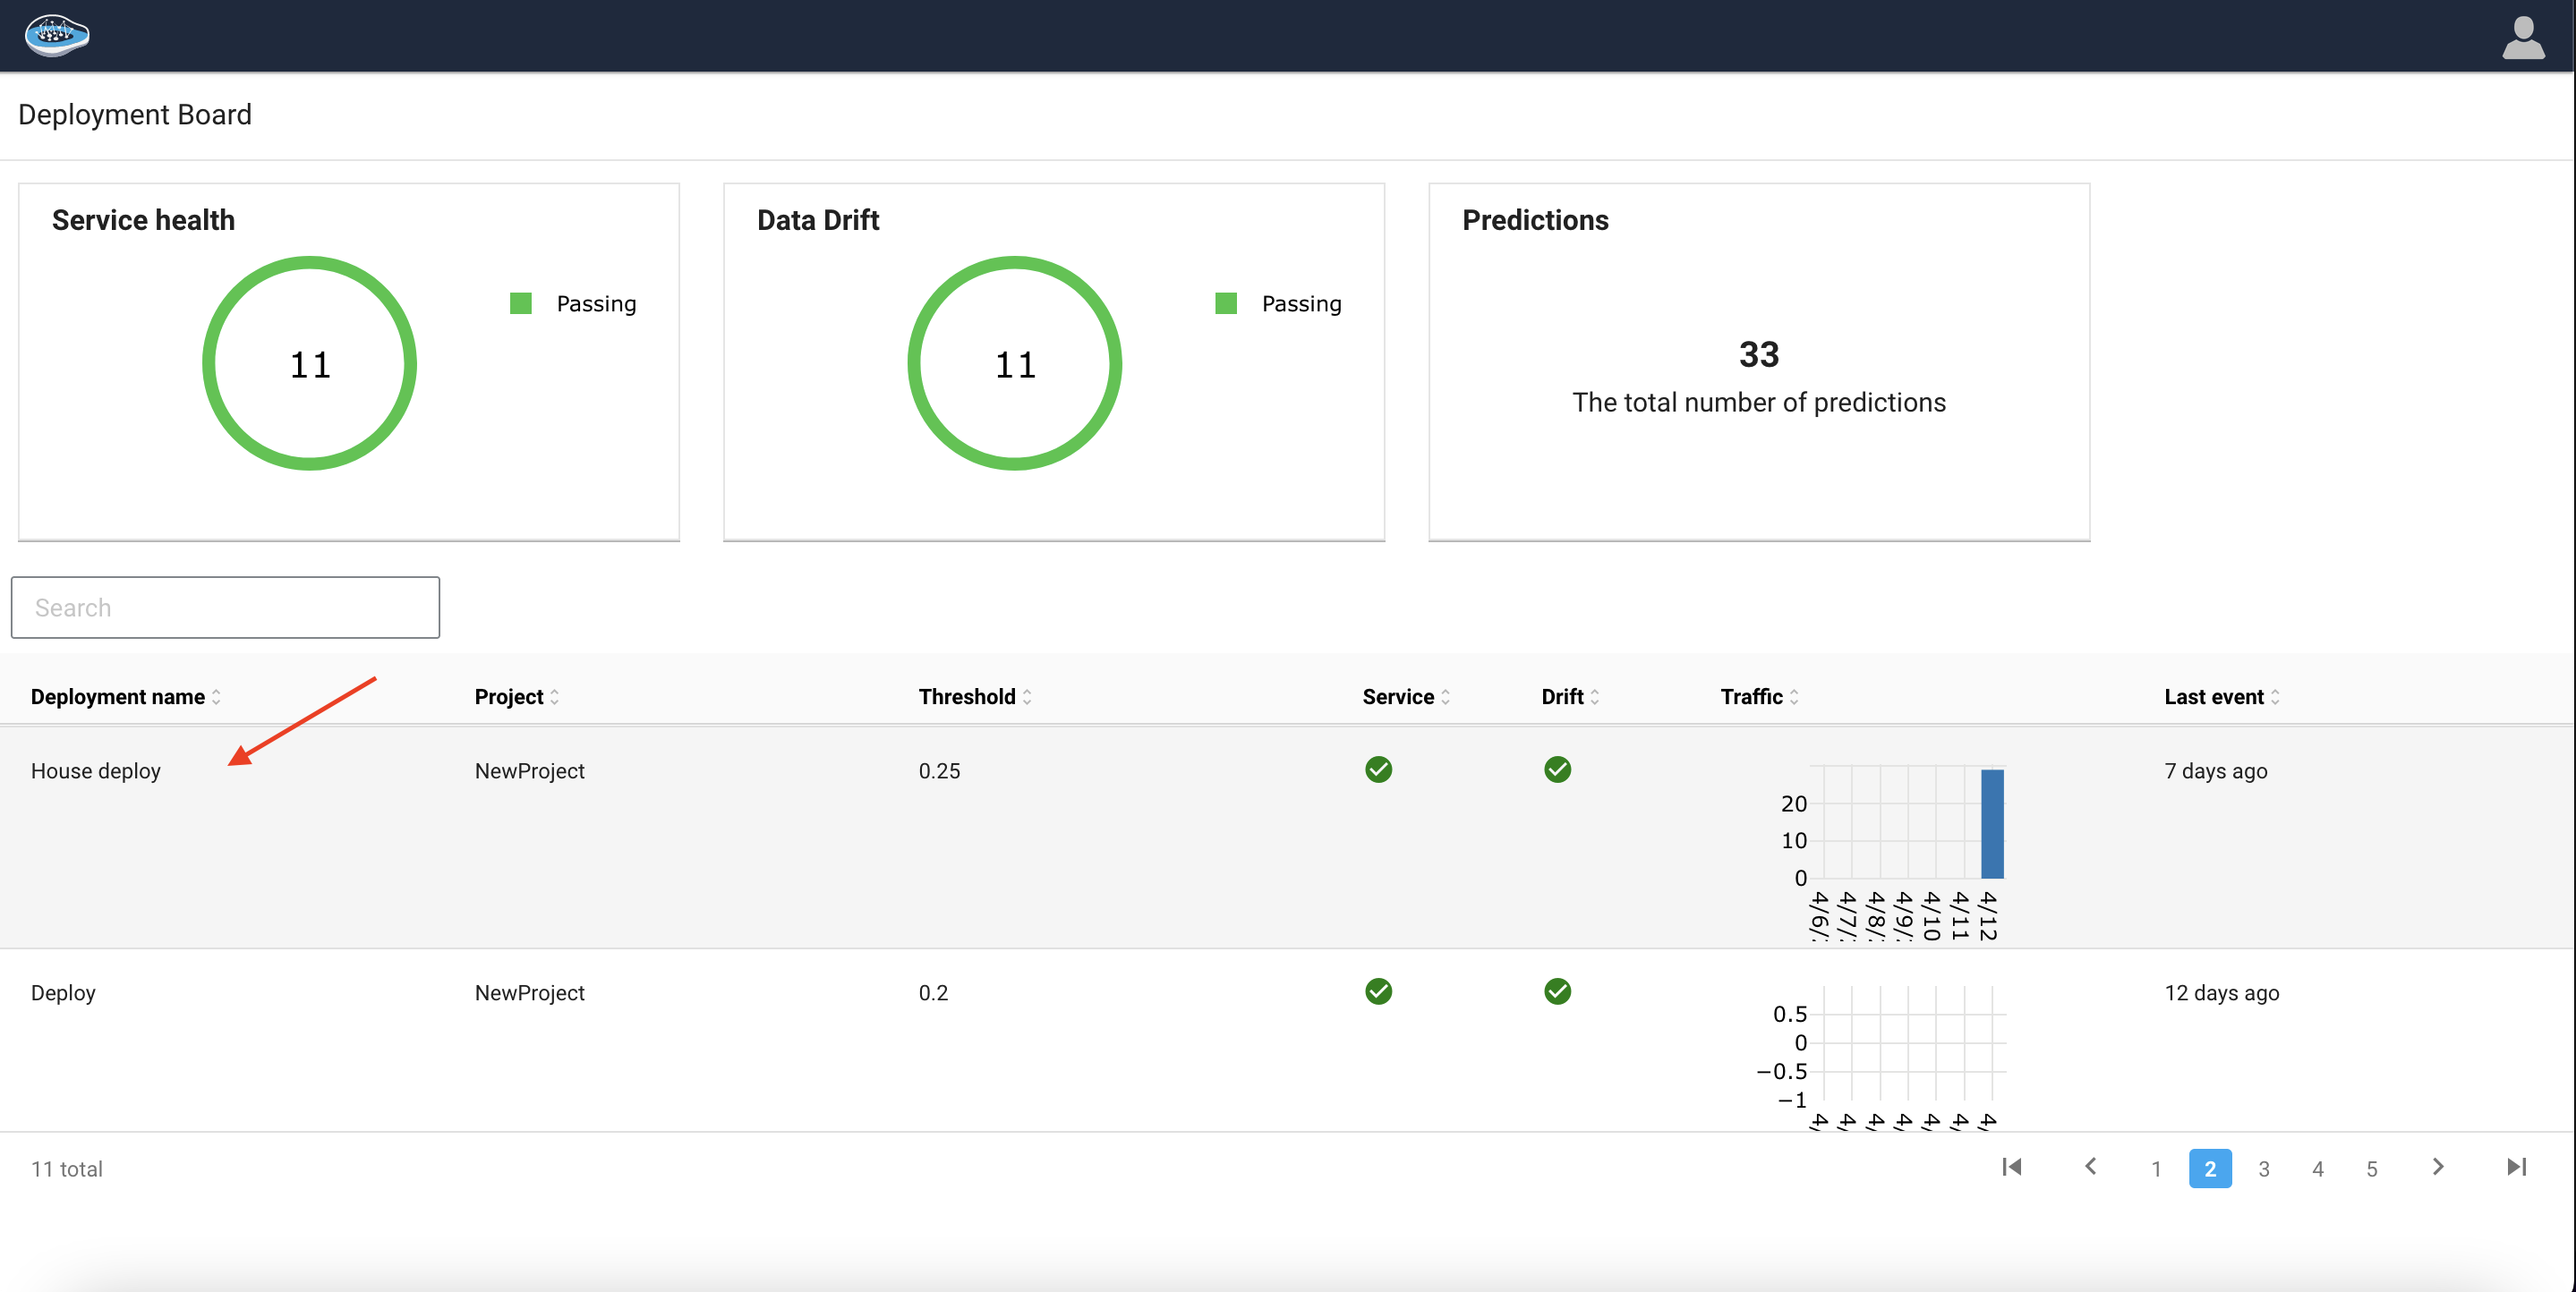
Monitoring
Monitoring your deployed machine learning models is essential to ensure that they continue to perform optimally and provide accurate predictions. The performance of your models can be impacted by a wide range of factors, including changes in data distribution, drift, and other environmental factors. To facilitate effective monitoring of your models, papAI provides a comprehensive dashboard that enables you to inspect every aspect of any deployed model.
The dashboard is designed to provide you with real-time updates on the performance of your models, allowing you to quickly identify any issues and take the necessary steps to address them. With the dashboard, you can monitor critical metrics such as accuracy, precision, recall, and F1-score, as well as other important parameters such as the number of samples processed, the time taken to process each sample, and the number of predictions made.
Additionally, the dashboard provides you with access to a wealth of information on model performance, including insights into data distribution, feature importance, and model explanations. This information can be used to identify potential issues with your models and to develop strategies for improving their performance.
Overview tab
Upon selecting a deployment from the Deployments dashboard, papAI will open the corresponding Overview page, which provides a concise summary of the deployment, including both model- and environment-specific details.
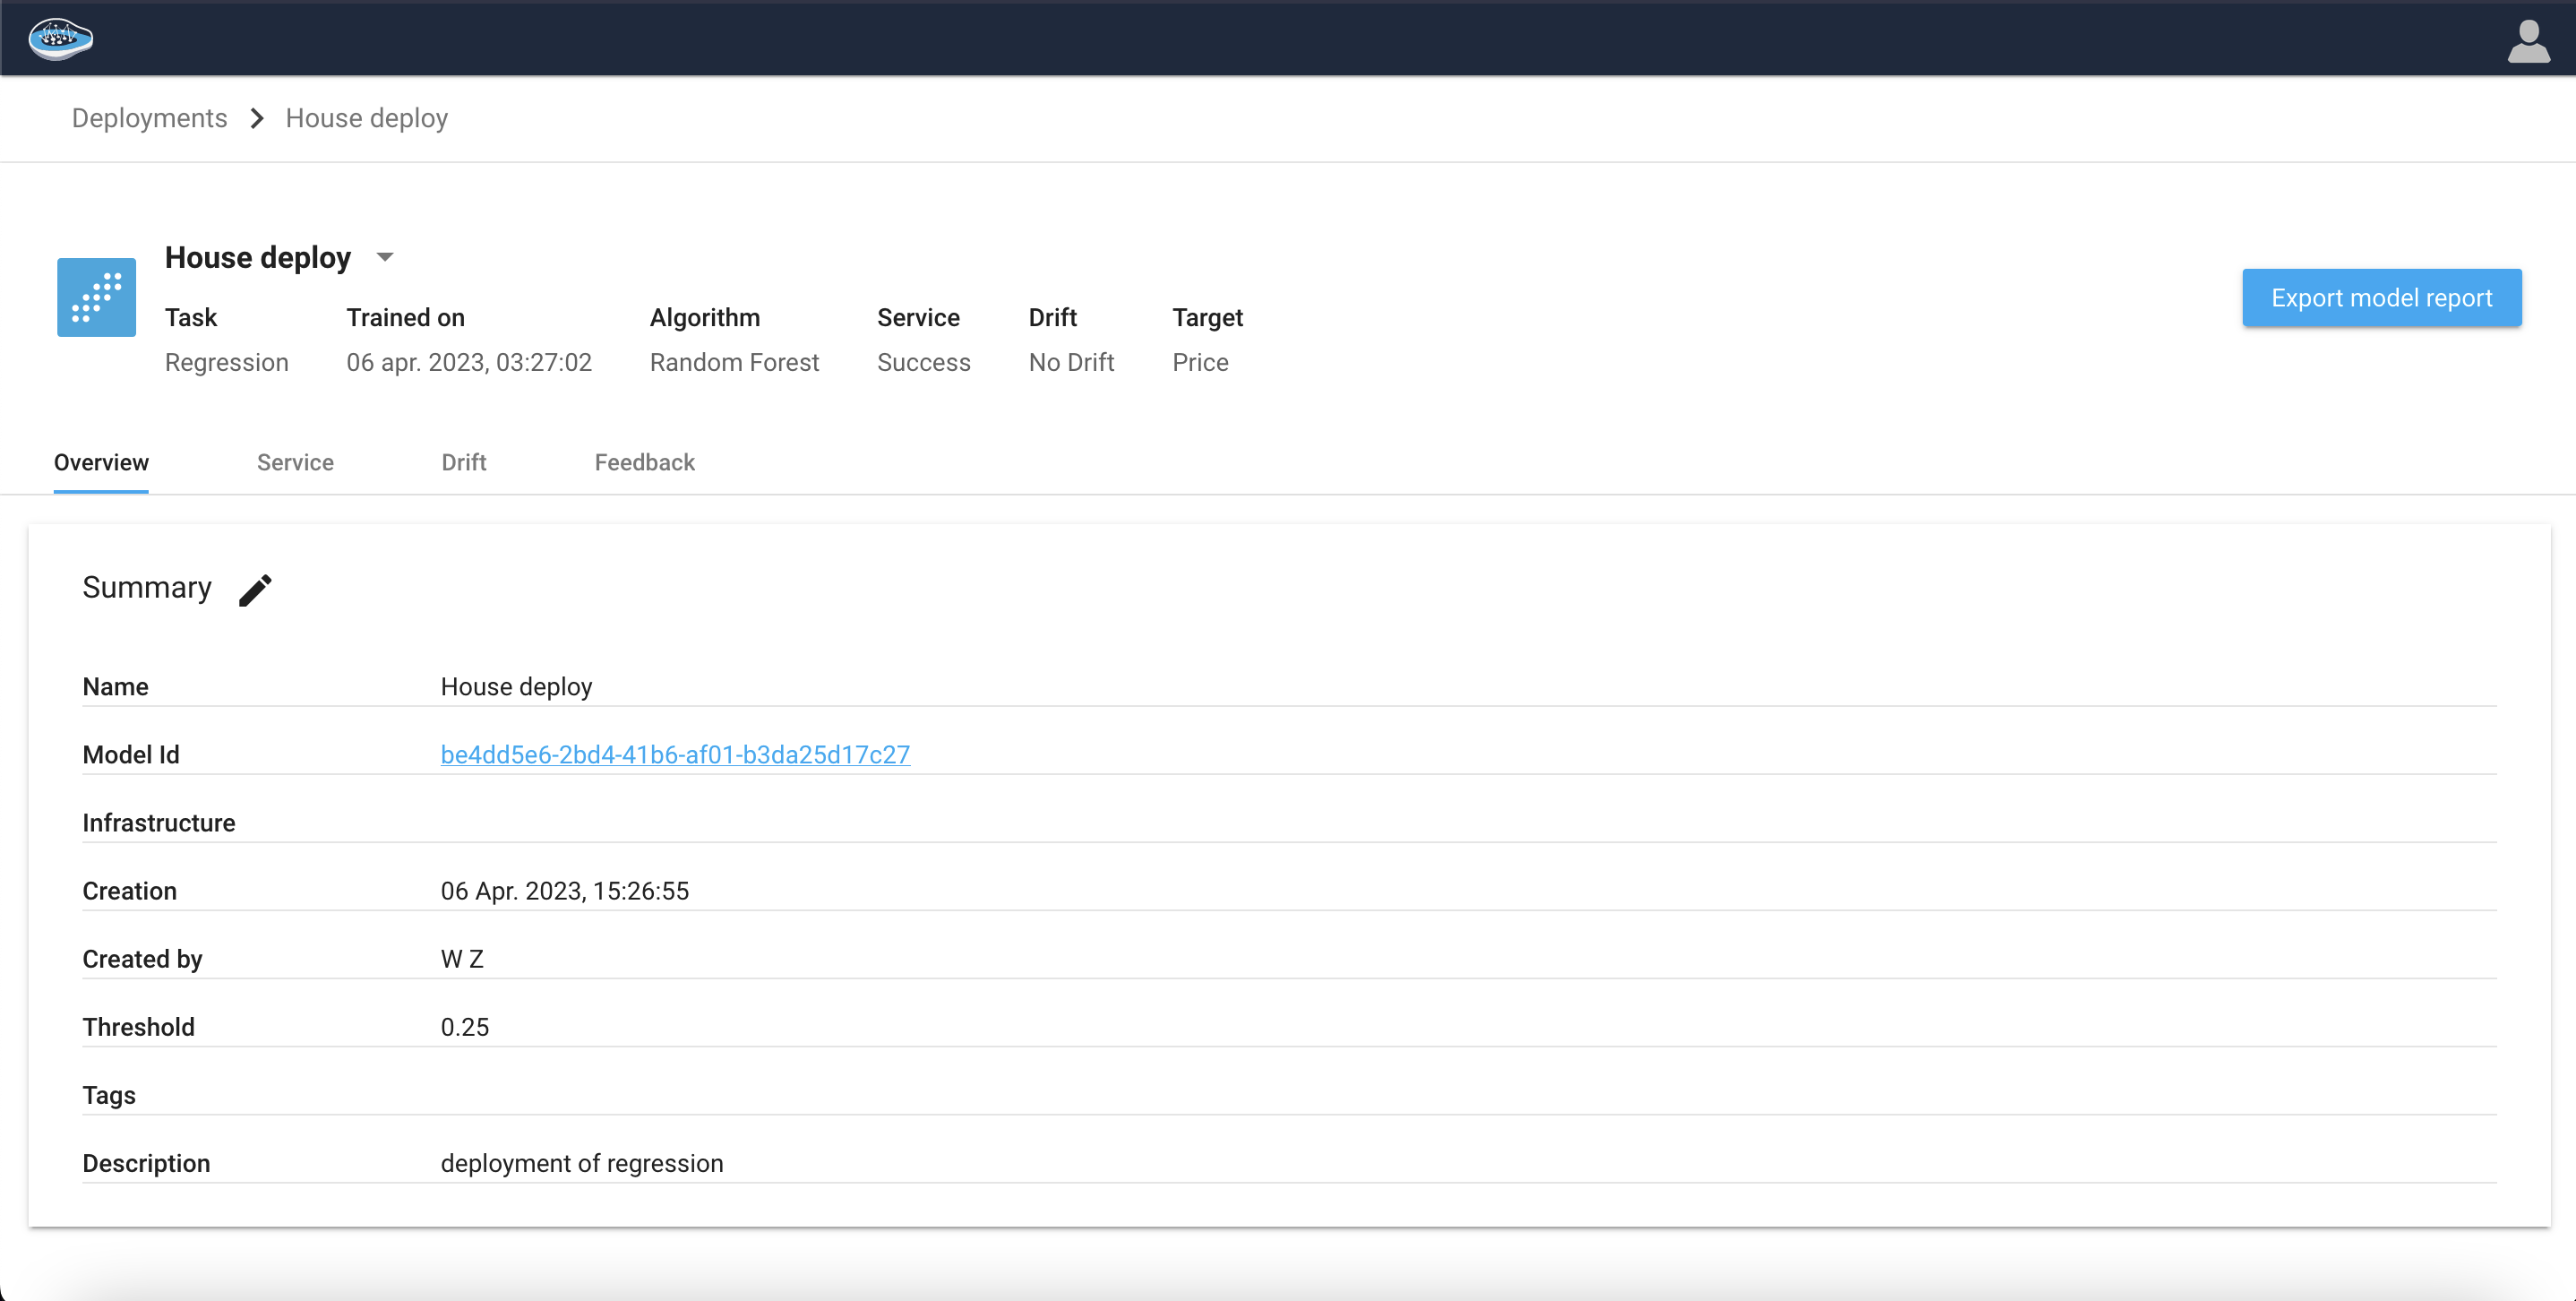
The Summary section displays user-provided details pertaining to the deployment, which encompasses the following information:
| Field | Description |
|---|---|
| Name | The name provided for the deployment |
| Description | The description provided for the deployment |
| Model ID | The unique identification number of the current model associated with the deployment |
| Creation Date | The date when the deployment was created |
| Created by | The user account associated with the deployment creation |
| Drift threshold | The user-defined threshold value used for drift detection in the deployed model |
| Tags | Any relevant tags assigned to the deployment |
Tip
Users can click on the Pencil icon to edit the information displayed in this section. Any changes made will be reflected on the Deployment page.
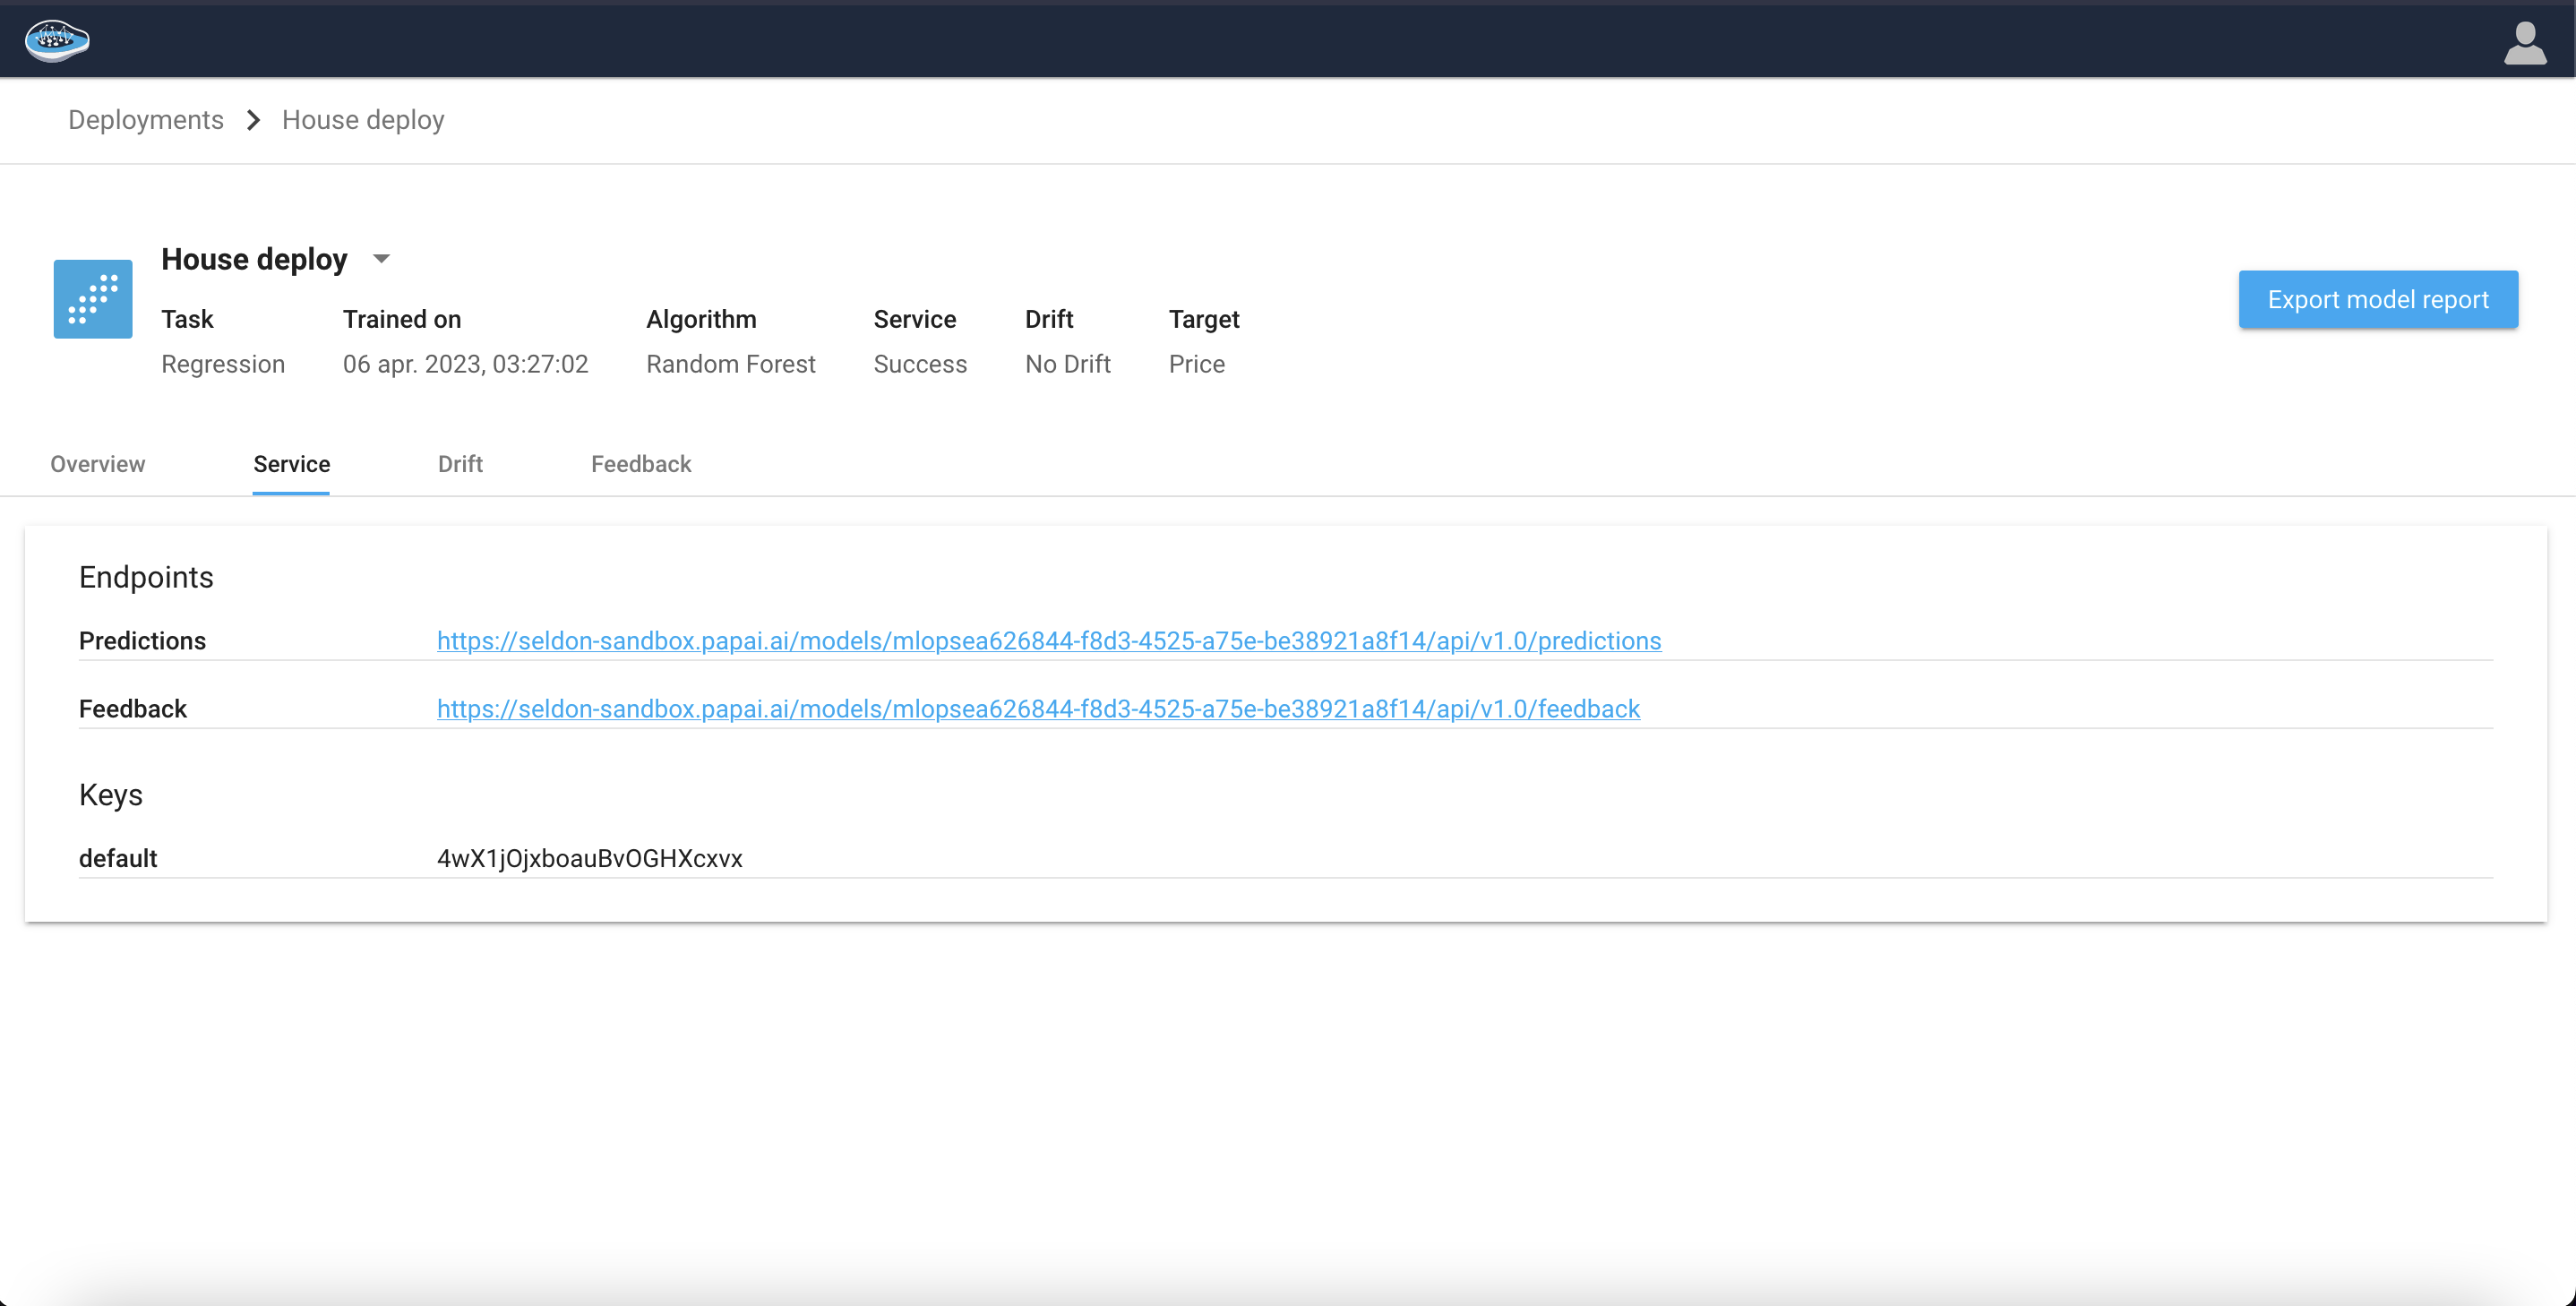
Service tab
Drift tab
The Data Drift dashboard is a crucial feature of a professional data platform that uses AI models. As the training and production data change over time, the model can lose its predictive power due to data drift. The Data Drift dashboard leverages the training and inference data added to the deployment to help analyze the model's performance after deployment. The dashboard provides valuable insights into how the model is performing and allows users to monitor the drift in the data, which can lead to changes in the model's accuracy. With this dashboard, users can quickly identify when drift occurs and take the necessary steps to address it, ensuring that the model remains accurate and reliable over time.
Feature details
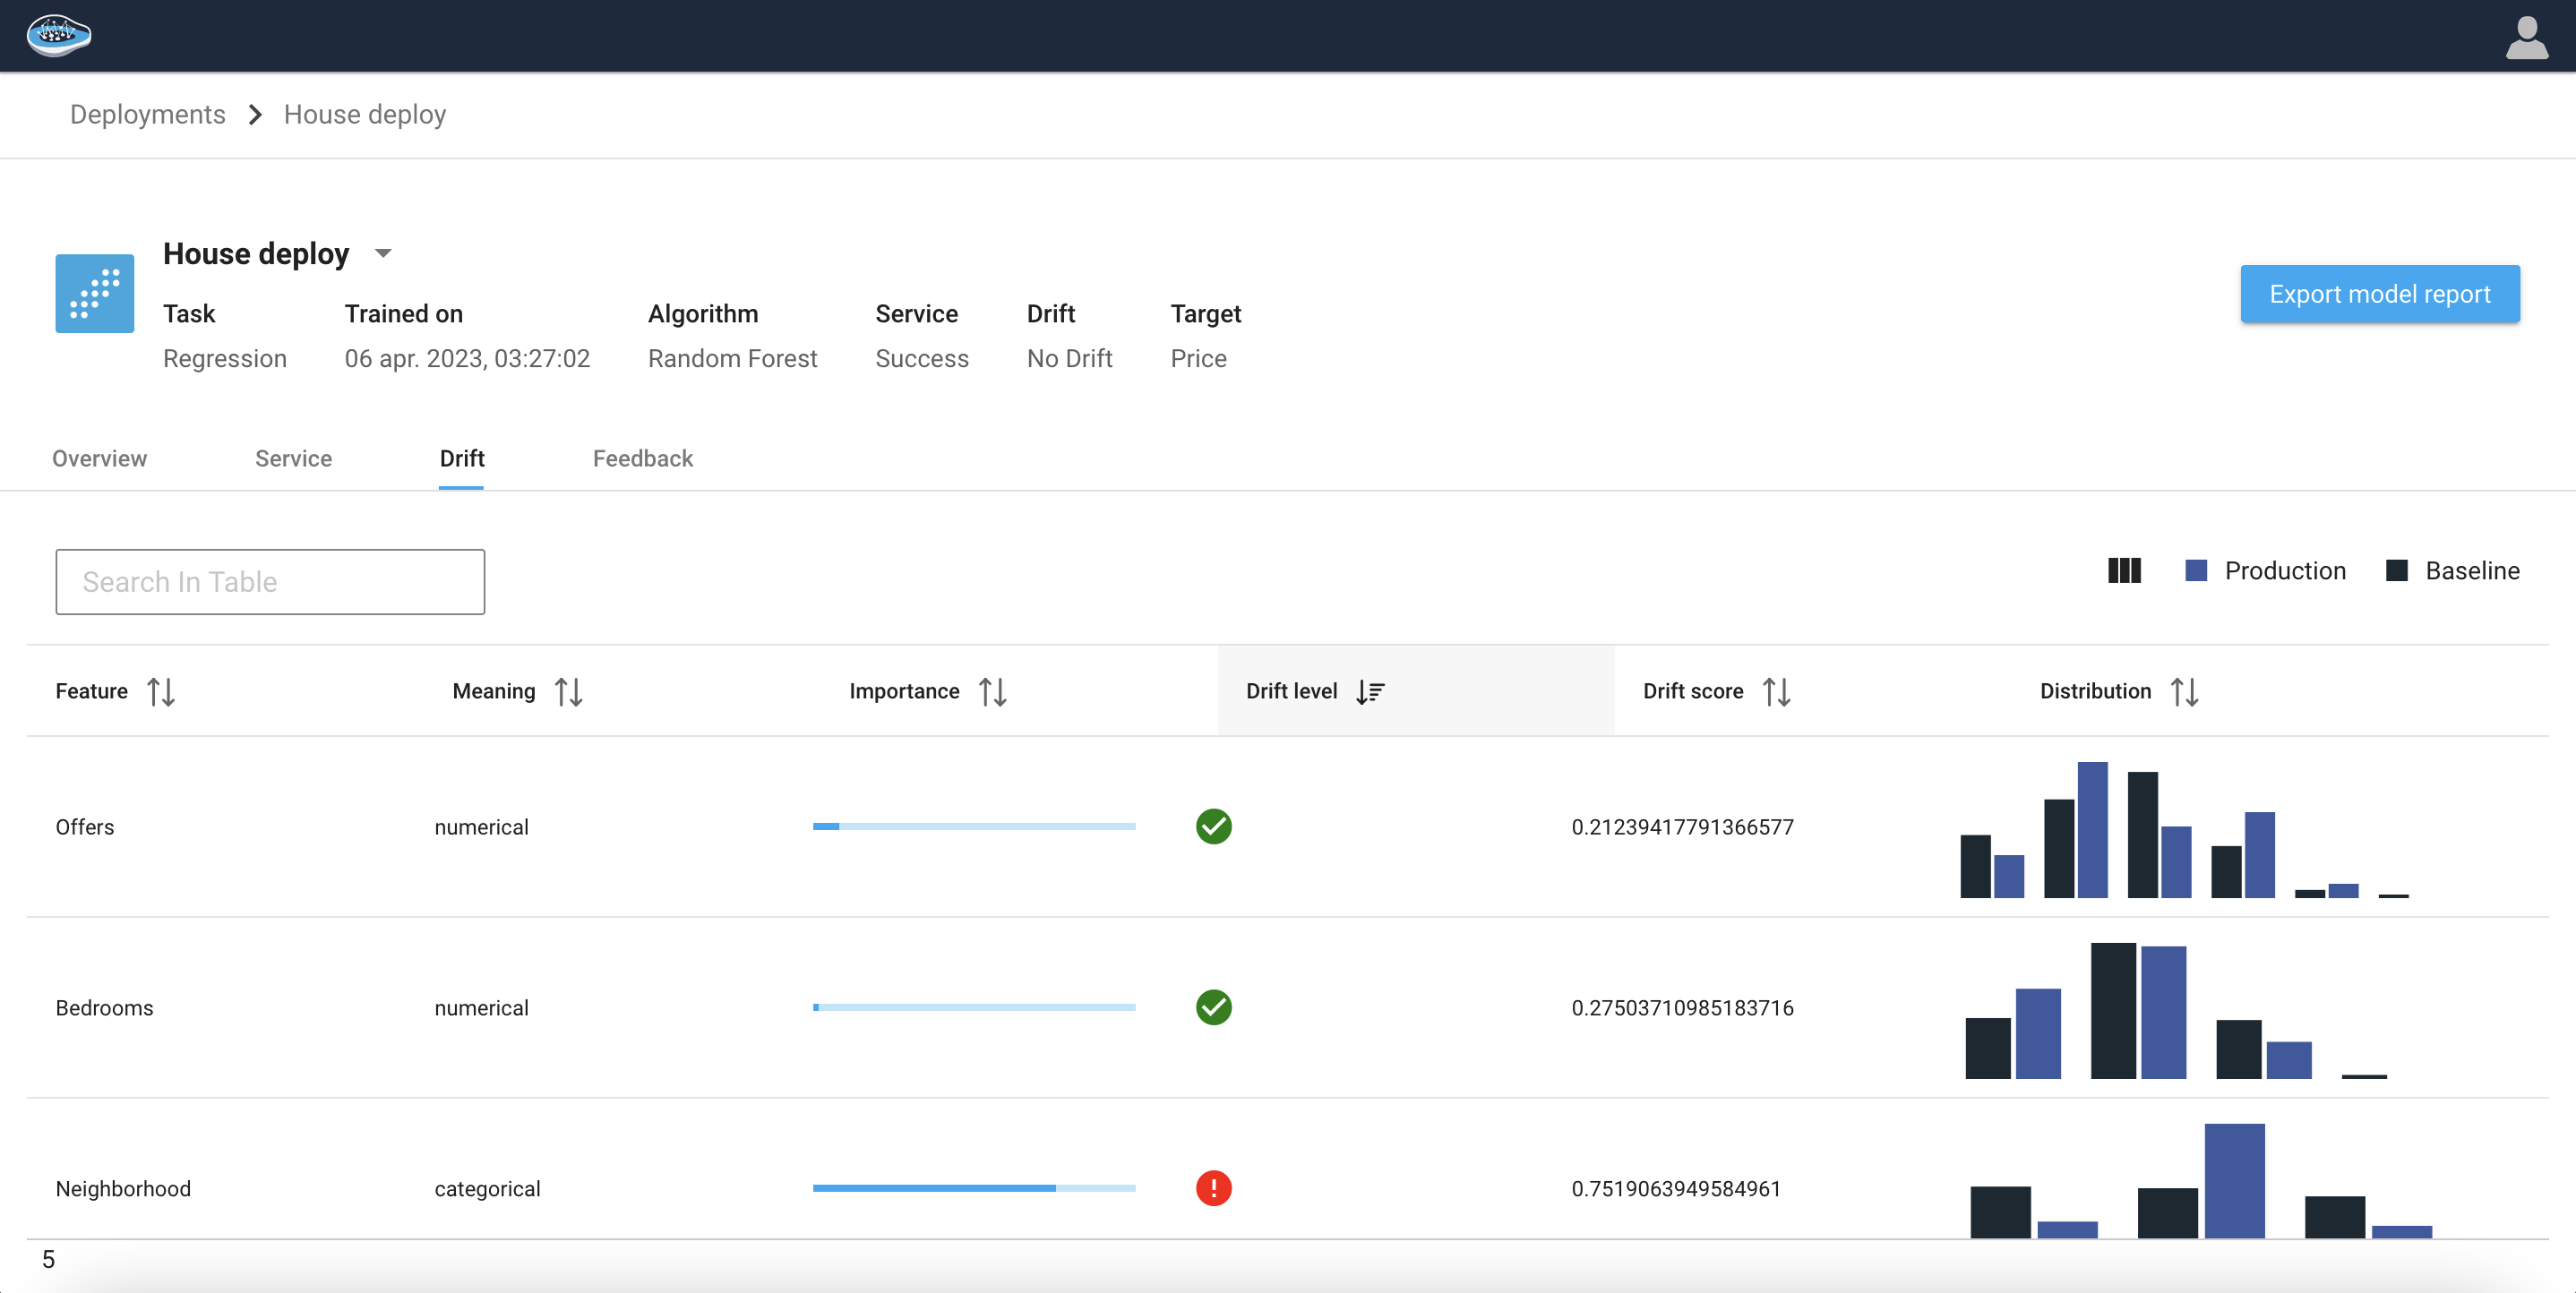
The Feature Details dashboard presents a table that summarizes important information about each feature in the deployed model. The table includes the following columns:
| Column Name | Description |
|---|---|
| Feature | The name of the feature being analyzed. |
| Meaning | Indicates whether the feature is categorical or numerical. |
| Drift Score | A numerical value that indicates the level of drift detected in the feature between the training data and the inference data. |
| Drift Level | A boolean that indicates whether drift has been detected in the feature or not. |
| Distribution | A histogram that compares the distribution of the feature in the training data to the distribution of that feature in the inference data. This visualization helps users to quickly identify any changes in the feature distribution. |
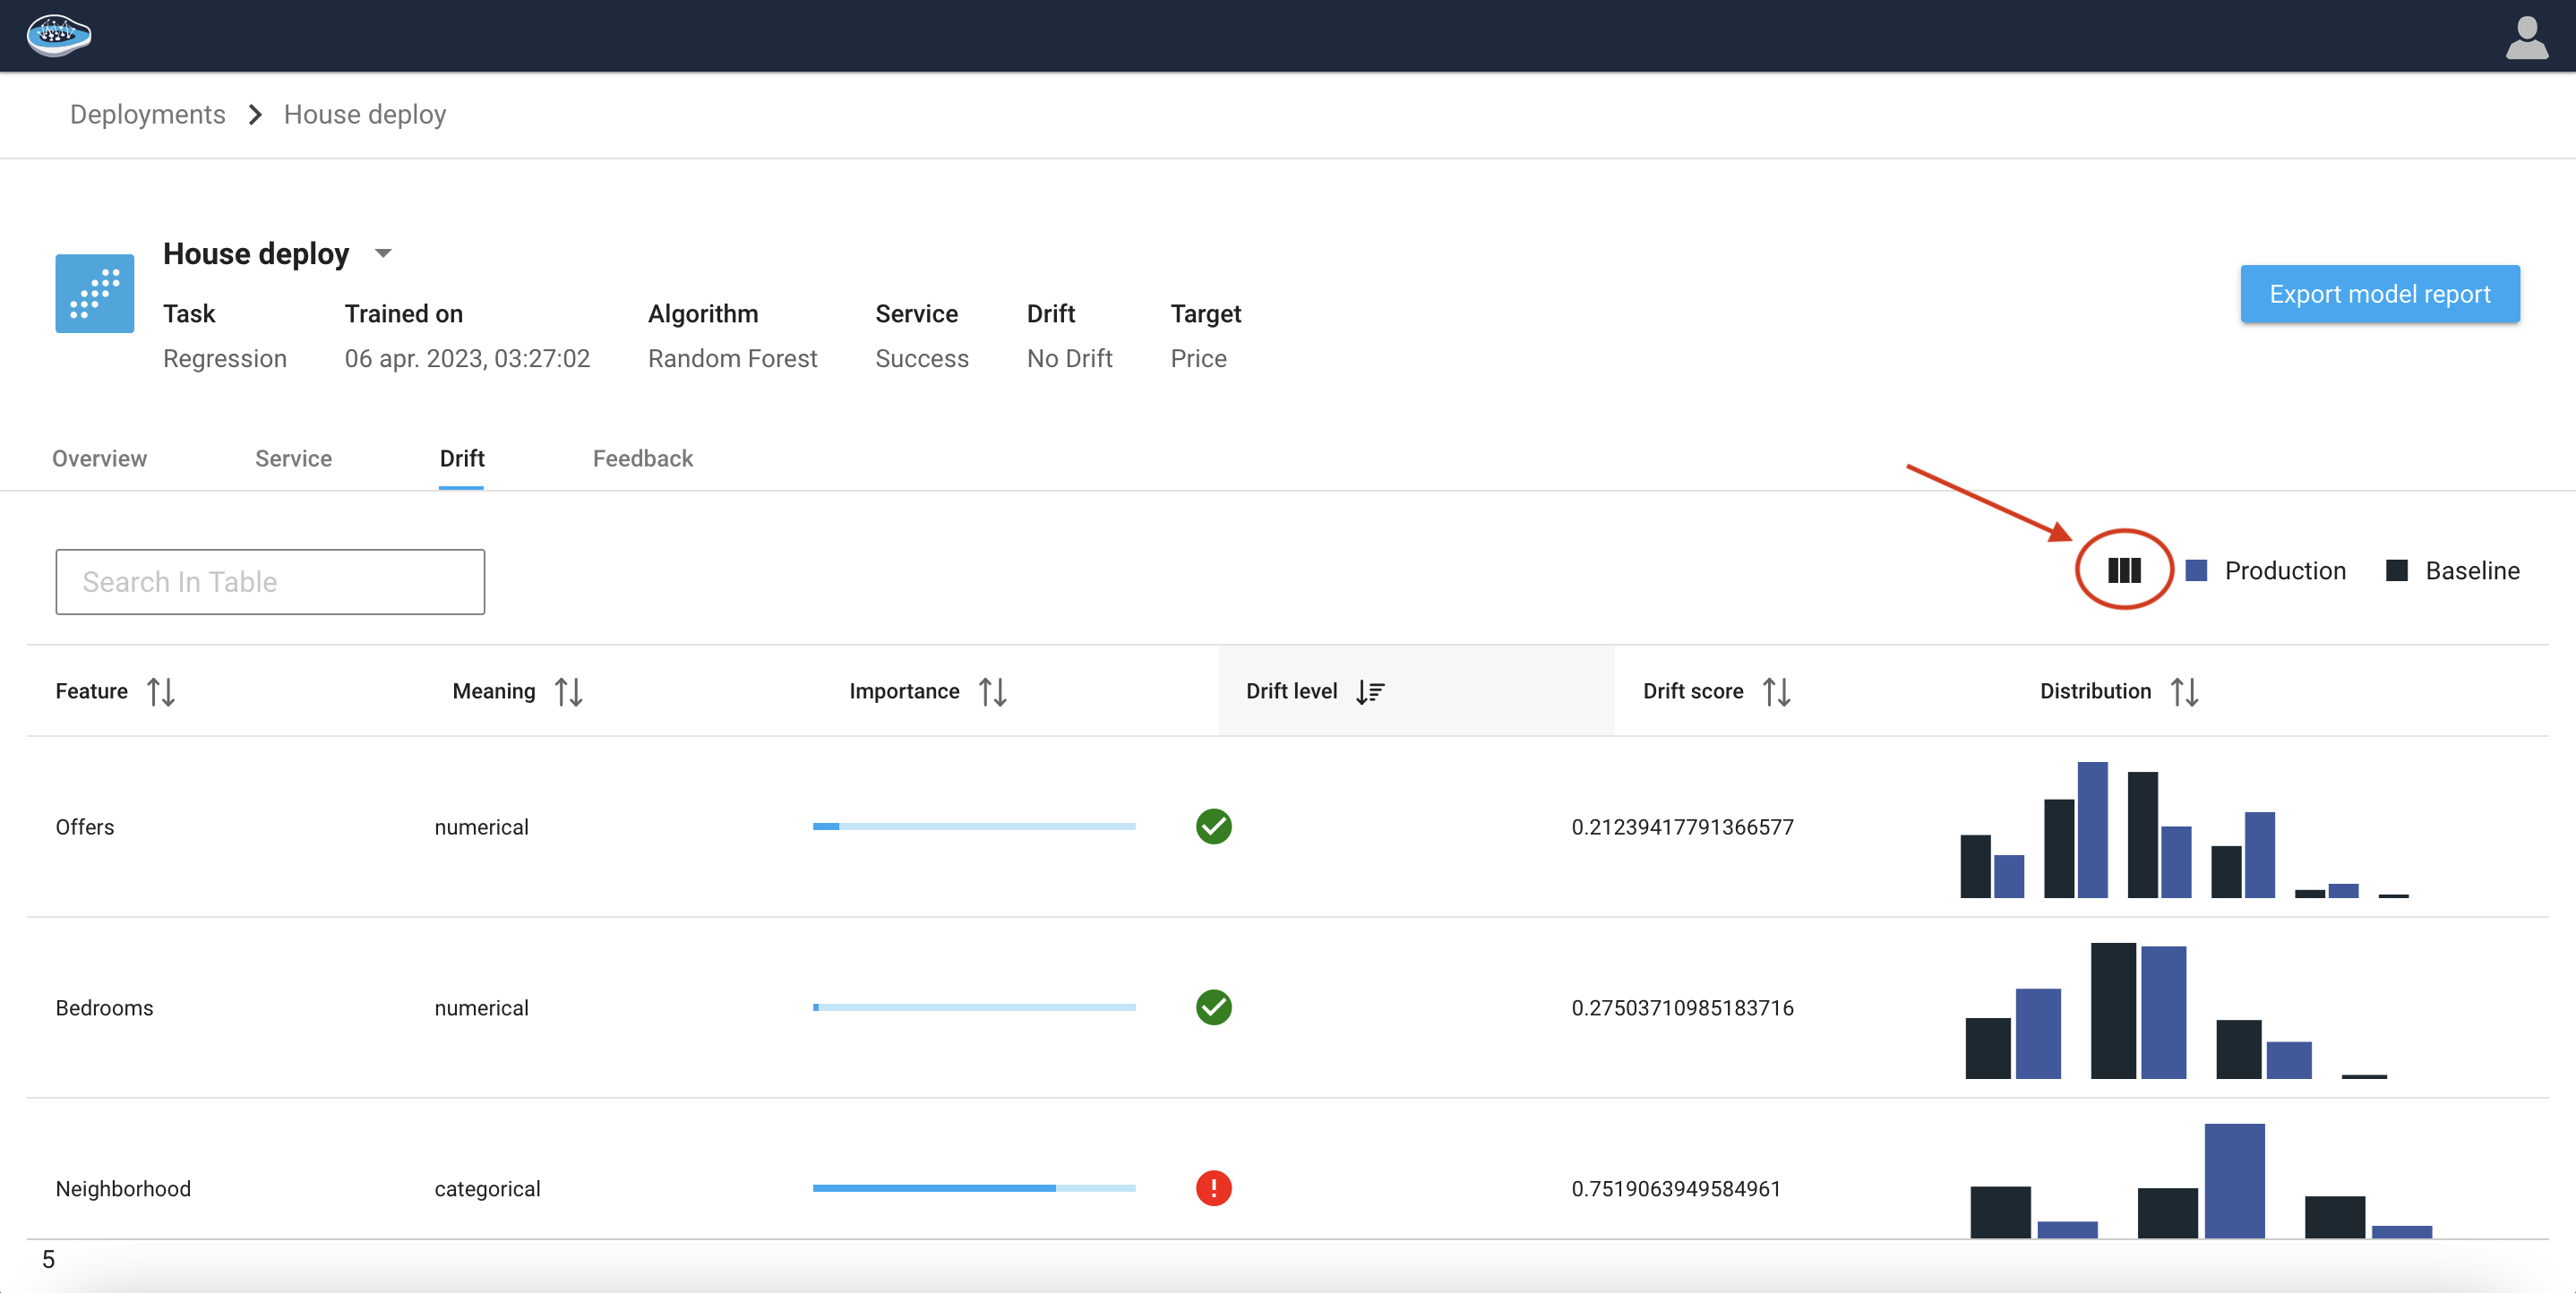
Through the icon, you get a clear view of the different charts offered to monitor the model predictions. Let's go through each and every chart in detail
Feature Importance vs. Drift
The function generates a graph that illustrates the correlation between the importance of a feature in a model and the extent of the observed distribution drift in actual feature values between two time points.
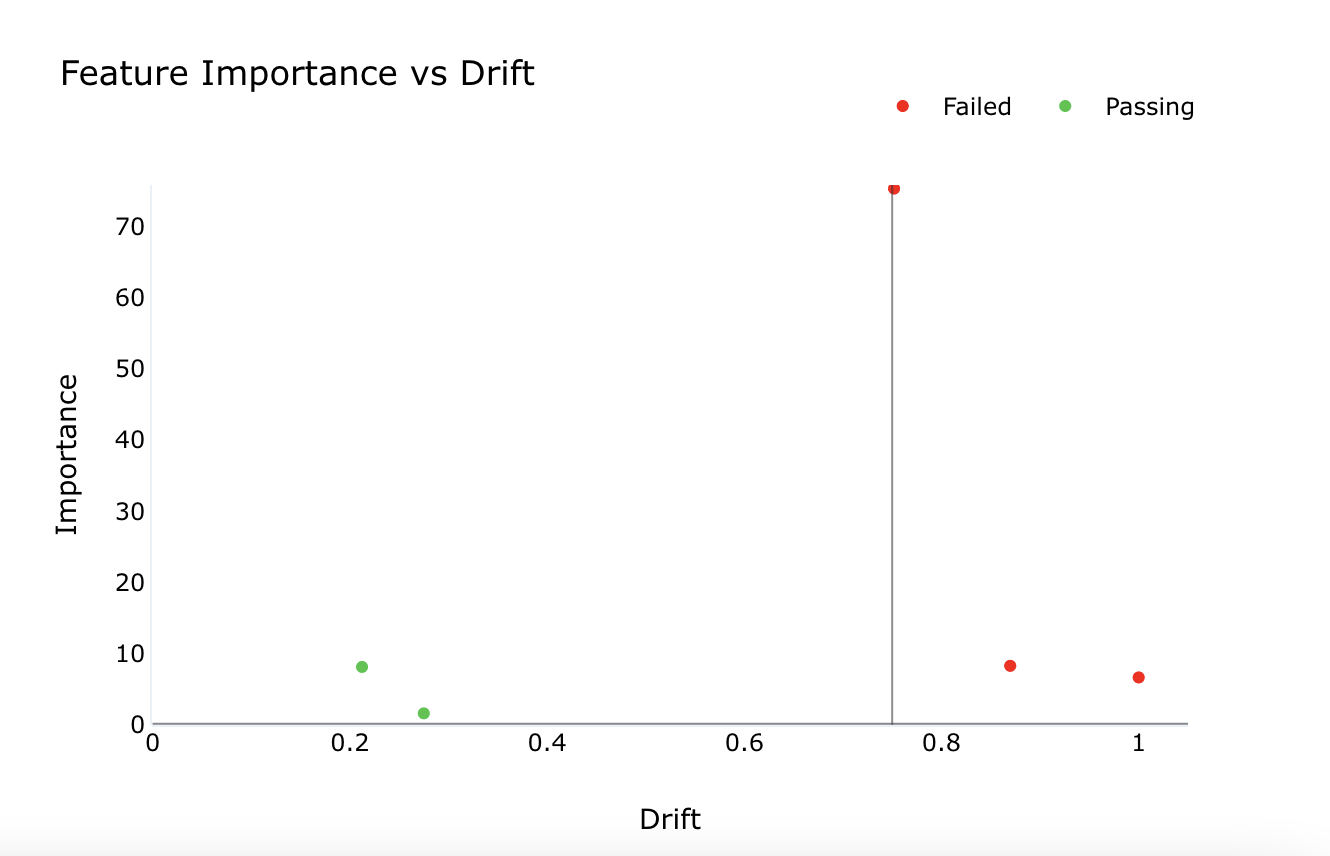
The color indicator on the dashboard represents the drift level of features as follows:
- Red: High importance feature(s) have a significant drift level. Immediate investigation is required to identify and address the root cause of the drift.
- Yellow: Lower importance feature(s) have a drift level above the set threshold. Continuous monitoring is recommended to ensure that the drift level does not become significant.
- Green: Lower importance feature(s) have minimal drift, and no action is necessary.
- Green: High importance feature(s) have minimal drift. No immediate action is necessary, but continuous monitoring is recommended for features that approach the drift threshold.
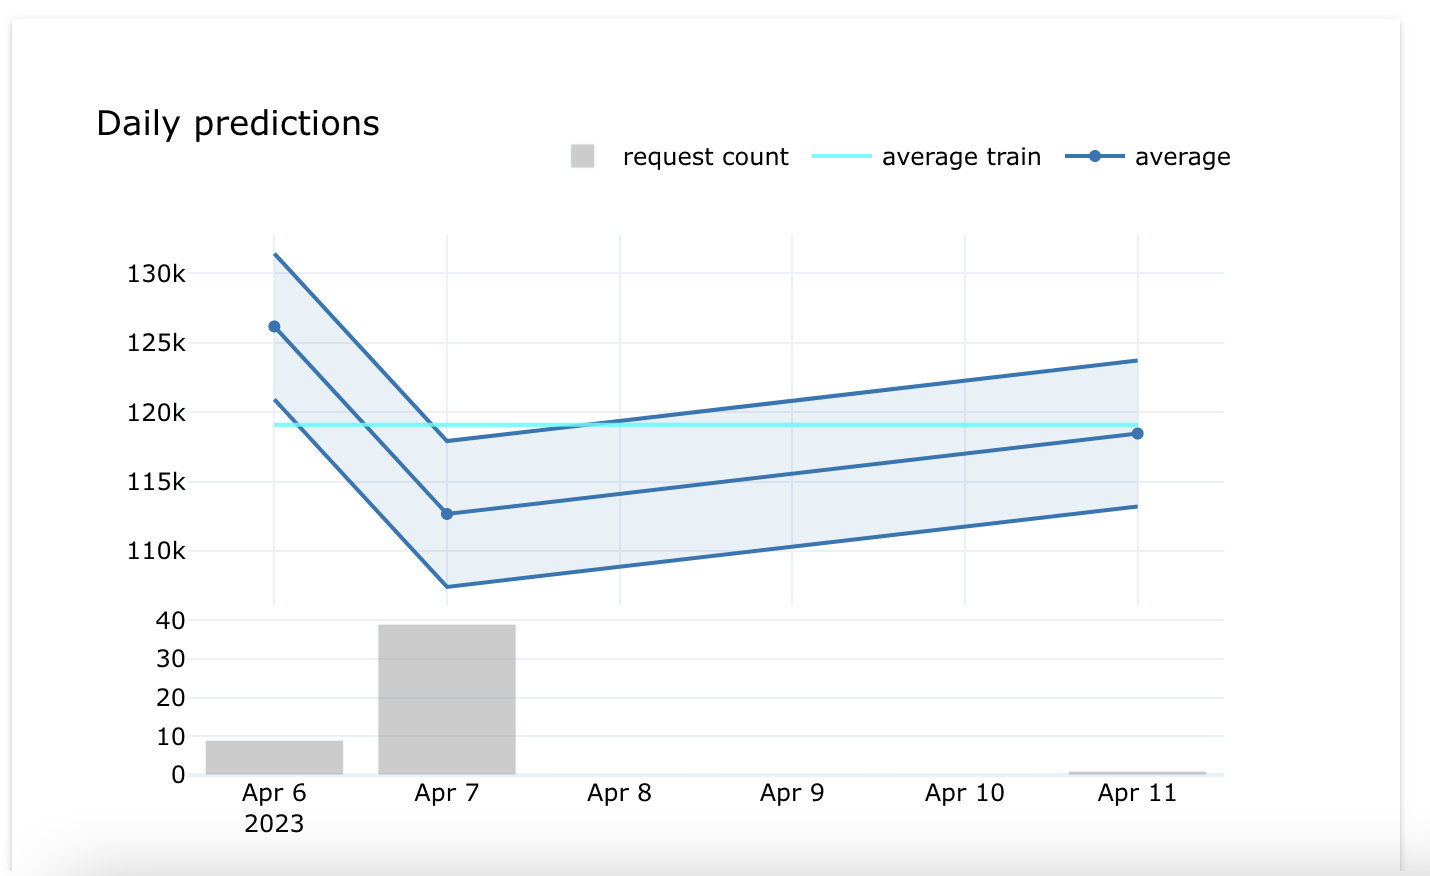
Daily predictions
The Daily predictions chart offers a quick and easy way to evaluate the model's prediction trends over a period of time. This chart helps in monitoring changes in the model's performance and identifying any potential issues that might have arisen during the deployment phase.
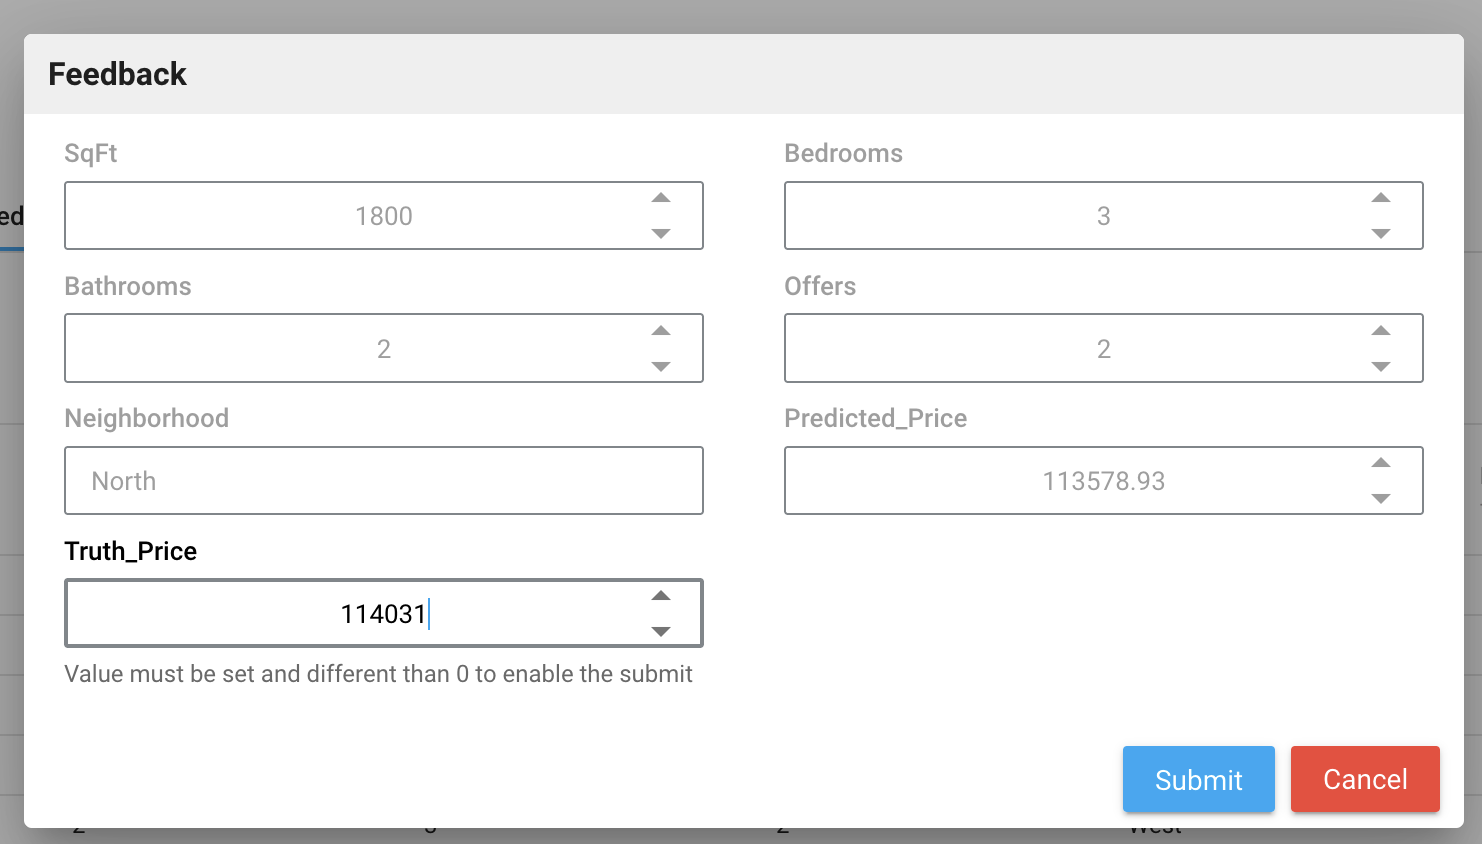
Feedback tab
Click the Feedback tab to display all the logs for each prediction.
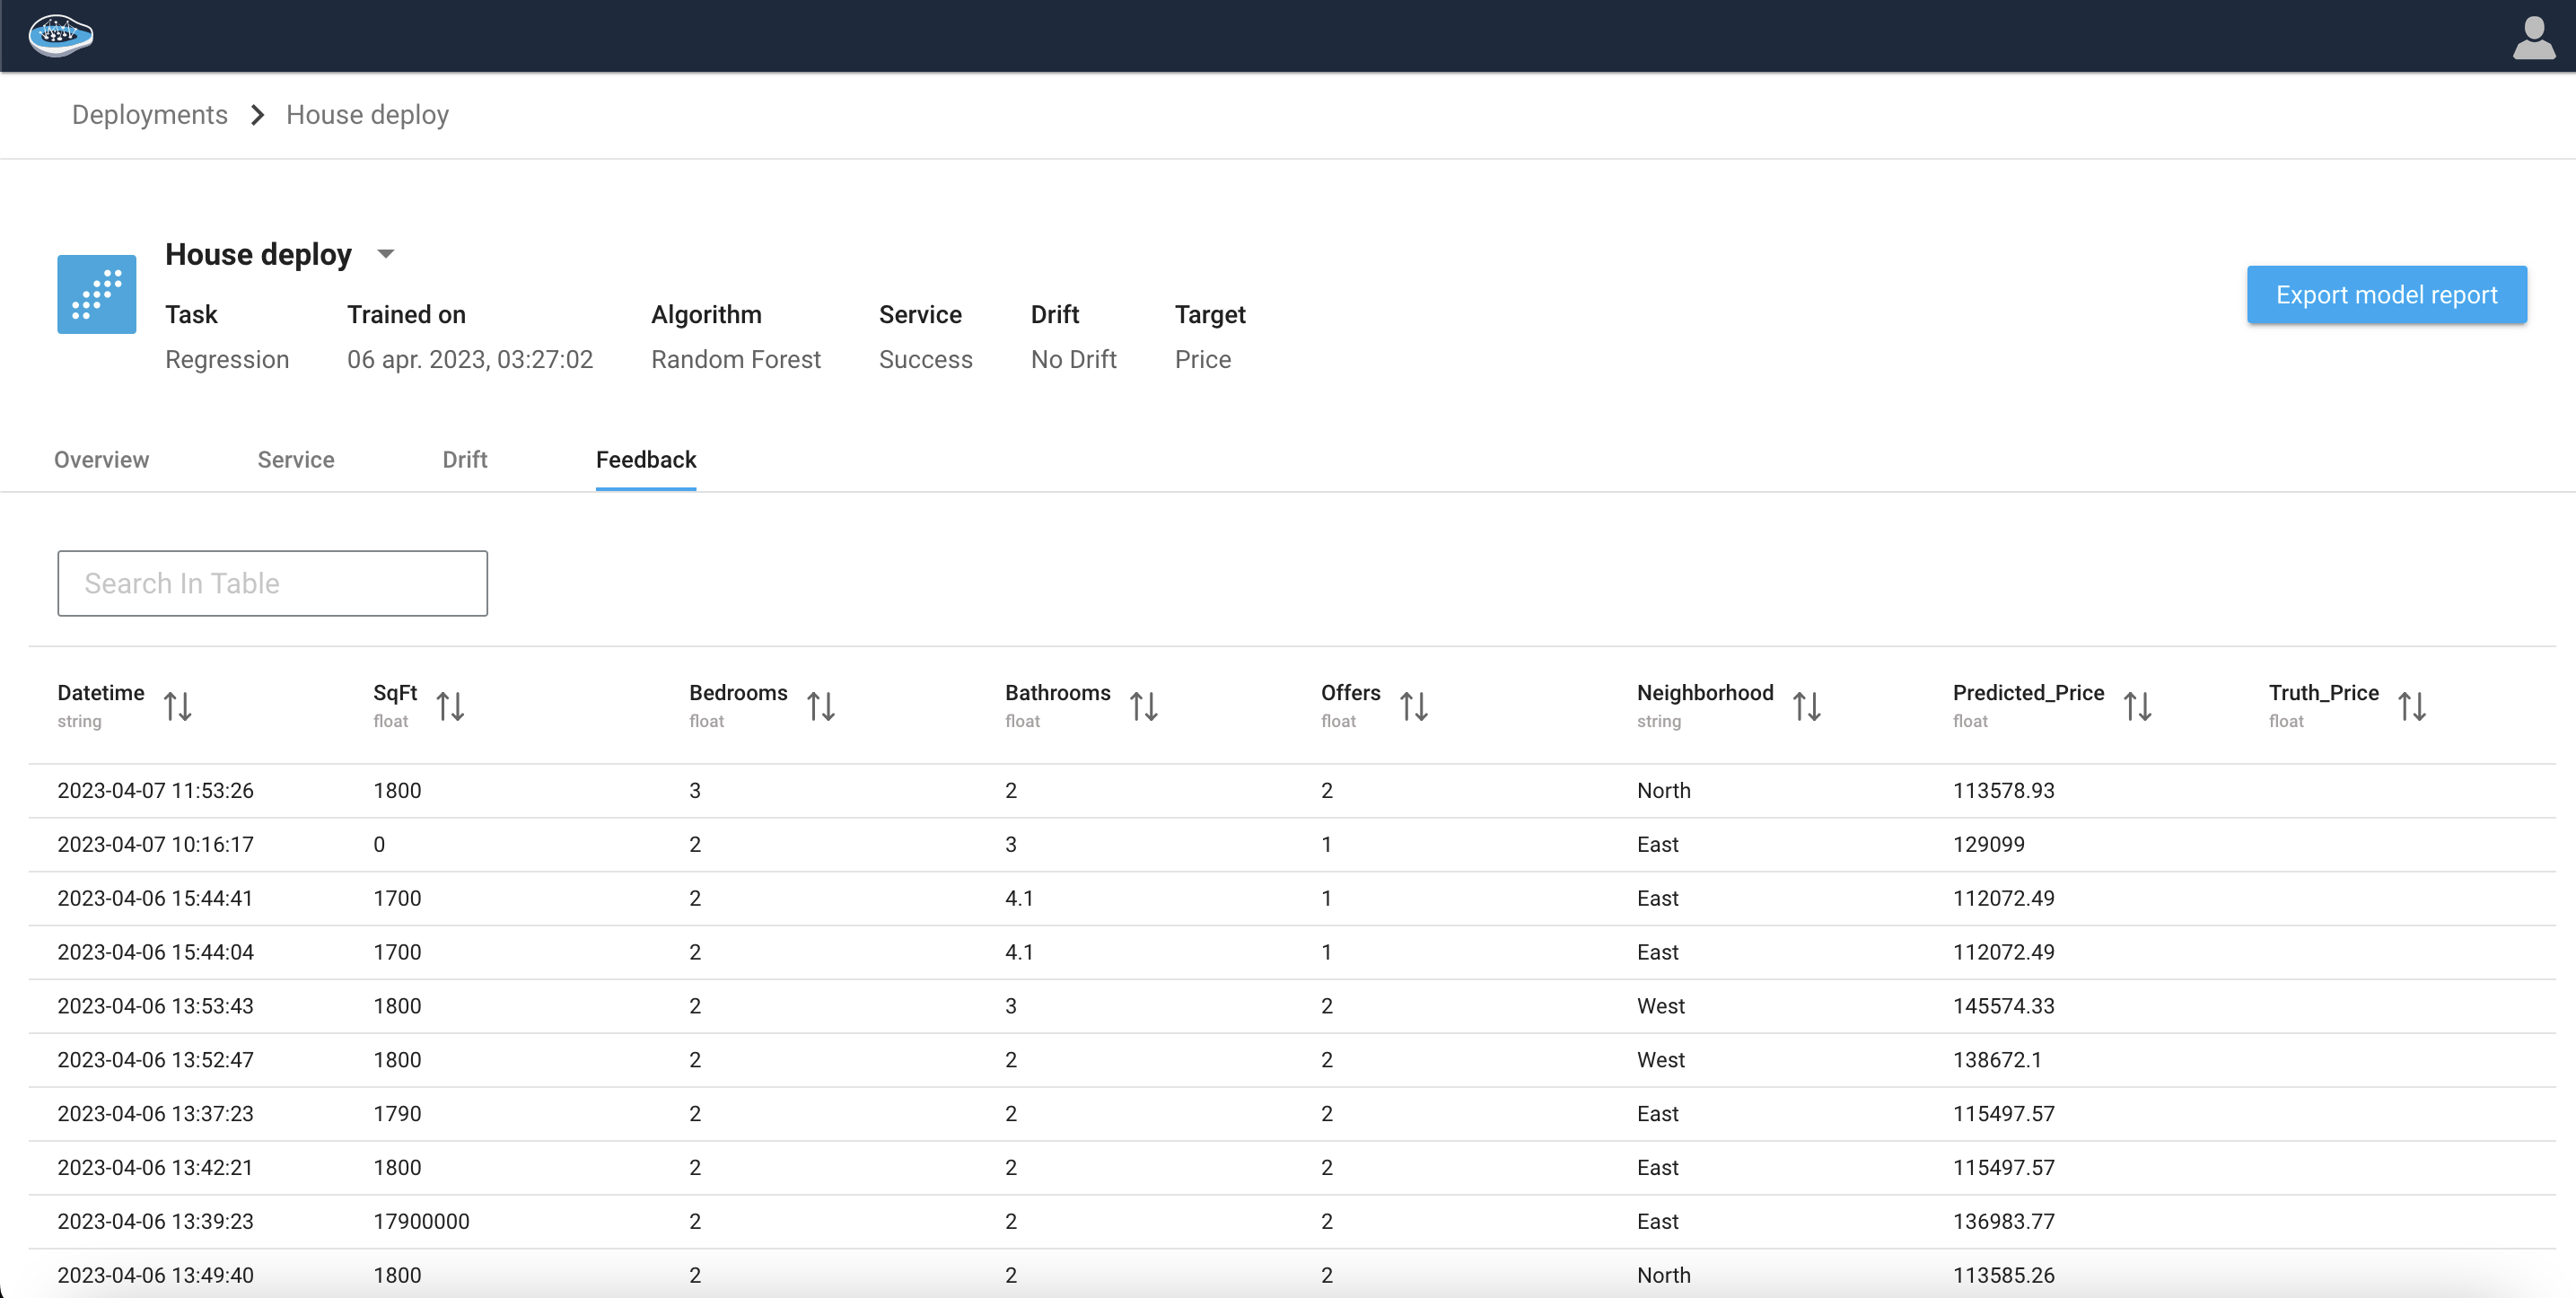
This tab is also be used to assess the performance of your model deployments. By clicking on a row of the logs table, user can upload data that includes both predicted and actual values.