Descriptive statistics
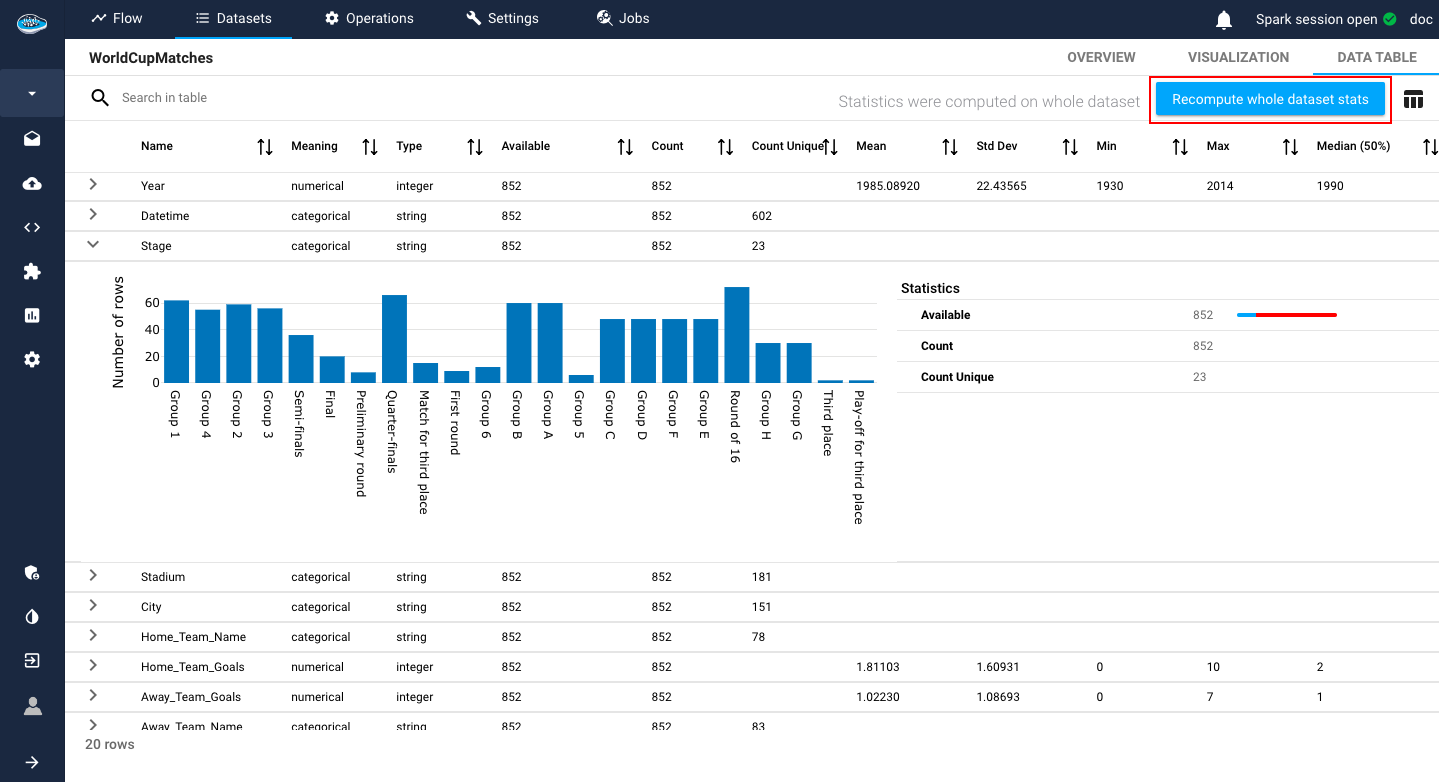
When looking through raw data, one of the first steps necessary to explore into it is through Descriptive statistics. When you upload a dataset into your project's flow, the sampled dataset's statistics are automatically calculated. When available, each column's stats are displayed in the Statistics tab as specified :
- Numerical columns :
- Count of rows
- quartiles : min, 25%, 50%, 75% and max
- mean value
- standard deviation
- proportion of missing data
- Categorical columns :
countof unique valuescountof rows- proportion of missing data
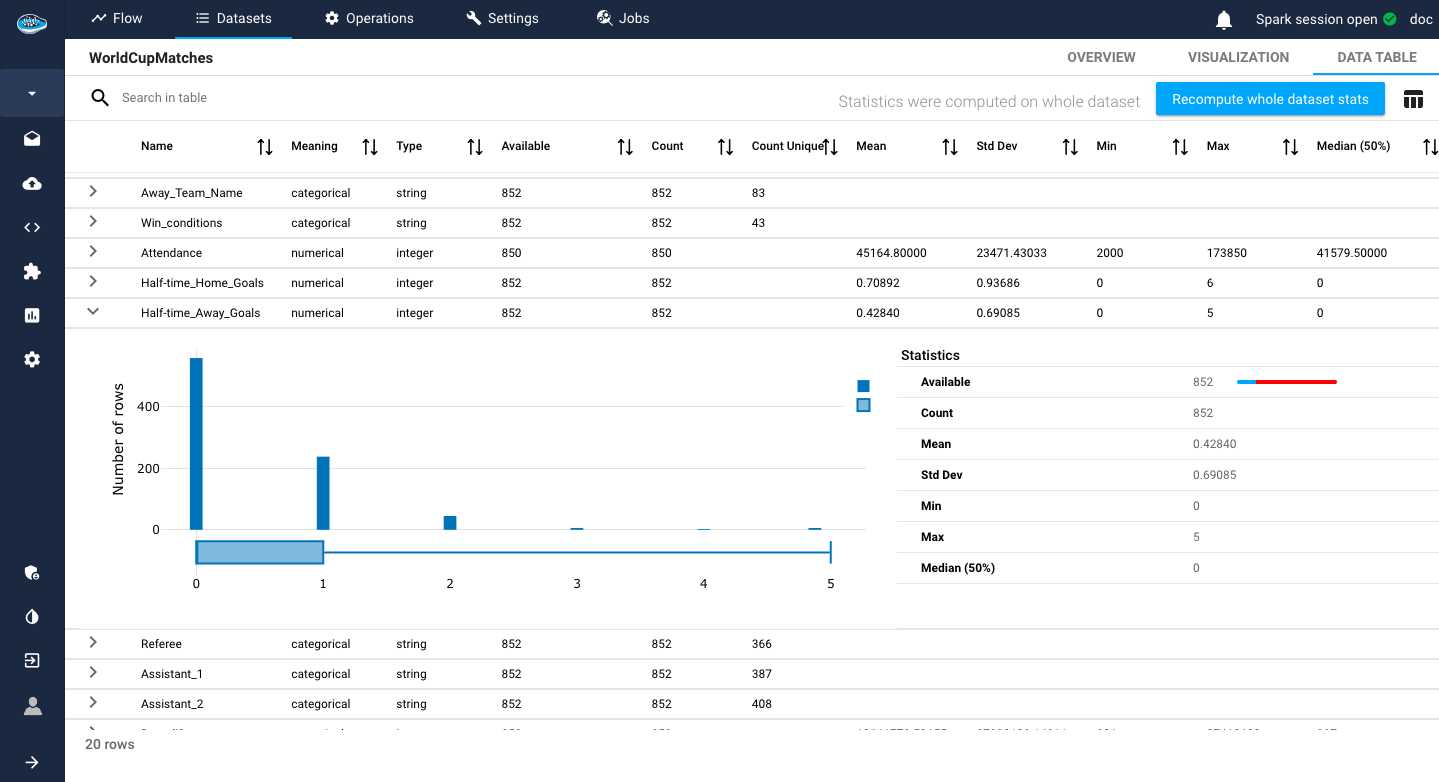
For either of categorical or numerical feature, you can look into a histogram of the sample distribution related to the feature by clicking on the icon right next to the feature's name.

Note
For numerical features, a boxplot of the data is also included with the histogram to get another analysis of the selected data.
Tip
The stats shown are just related to the sample but if you want the stats on the entire dataset, all you need is to type on the Recompute on the whole dataset button to trigger the operation and after waiting for a few moment, the stats will be refreshed corresponding to the whole dataset.